

Analytics — detailed table
Раздел Tracker → Analytics — детальная таблица всех метрик Tracker с возможностью фильтровать, группировать и экспортировать в CSV. В отличие от , which shows an overview and charts, Analytics is a wo
РазделTracker → Analytics— детальная таблица всех метрик
Tracker с возможностью фильтровать, группировать и экспортировать в CSV. В отличие от Dashboards — Summary Analytics, which shows an overview and charts, Analytics is a working tool for in-depth analysis: breakdowns by day / source / buyer / parameters, and a tabular view without visualizations.When to use Analytics
When preparing a report for a period (week, month, quarter) — you need specific numbers, not charts. When looking for an anomaly: "something strange happened yesterday, let's analyze it by day / hour / GEO". When comparing several campaigns / sources / GEOs in one table. When preparing a CSV for an accountant, client, or BI tool. When looking for effective / ineffective segments: comparing all sub1, ad_name, and buyers in one selection. Deep debugging: if I see something strange in Dashboards, I clarify it in Analytics.
Video tutorial
What you can do
The section provides five main capabilities:
- — View summary statistics for all campaigns (or those selected via filter).
- — Filter data by any traffic parameters (sub1, ad_name, buyer, GEO, …) —.
- — Group statistics by a selected parameter (Day, source_name, buyer, ad_name).
- — Export the slice to CSV —.
- — See the Total row with summary values based on selected conditions.
After applying filters and grouping, the table updates automatically — all numbers are recalculated for the selected slice. By default, general statistics for all user campaigns are shown.
Workflow steps
Open Analytics
Tracker→ Analytics. The general table for the last period loads.Select period and parameters
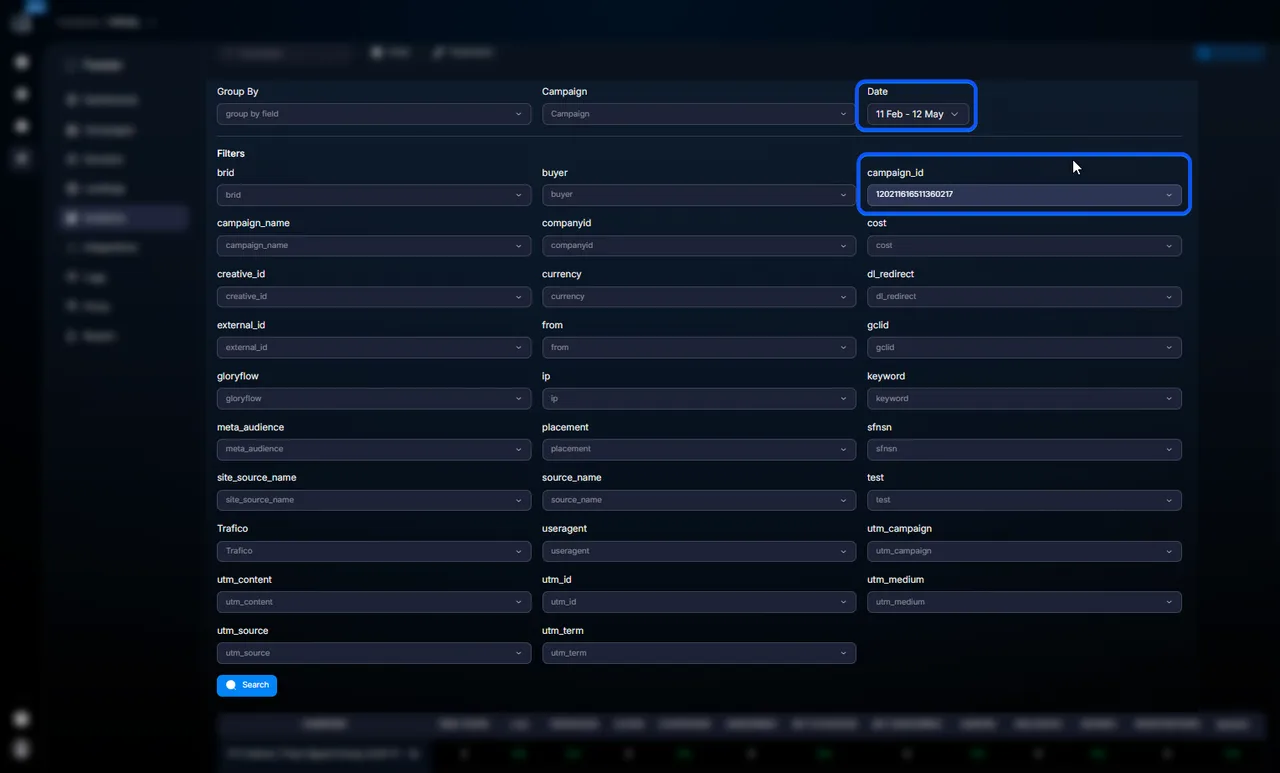
Period (week, month, custom range). If you need breakdowns, select grouping parameters and filters via Filtering and grouping.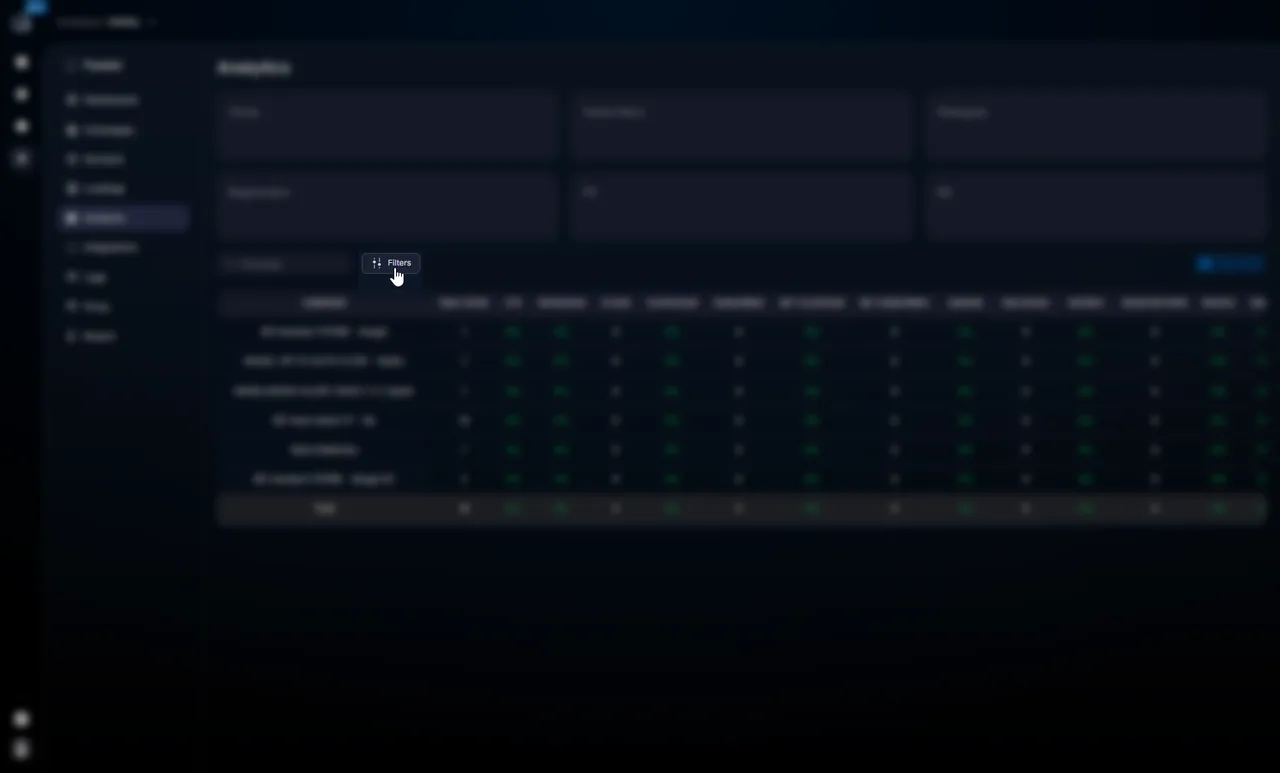
Study metrics and the table
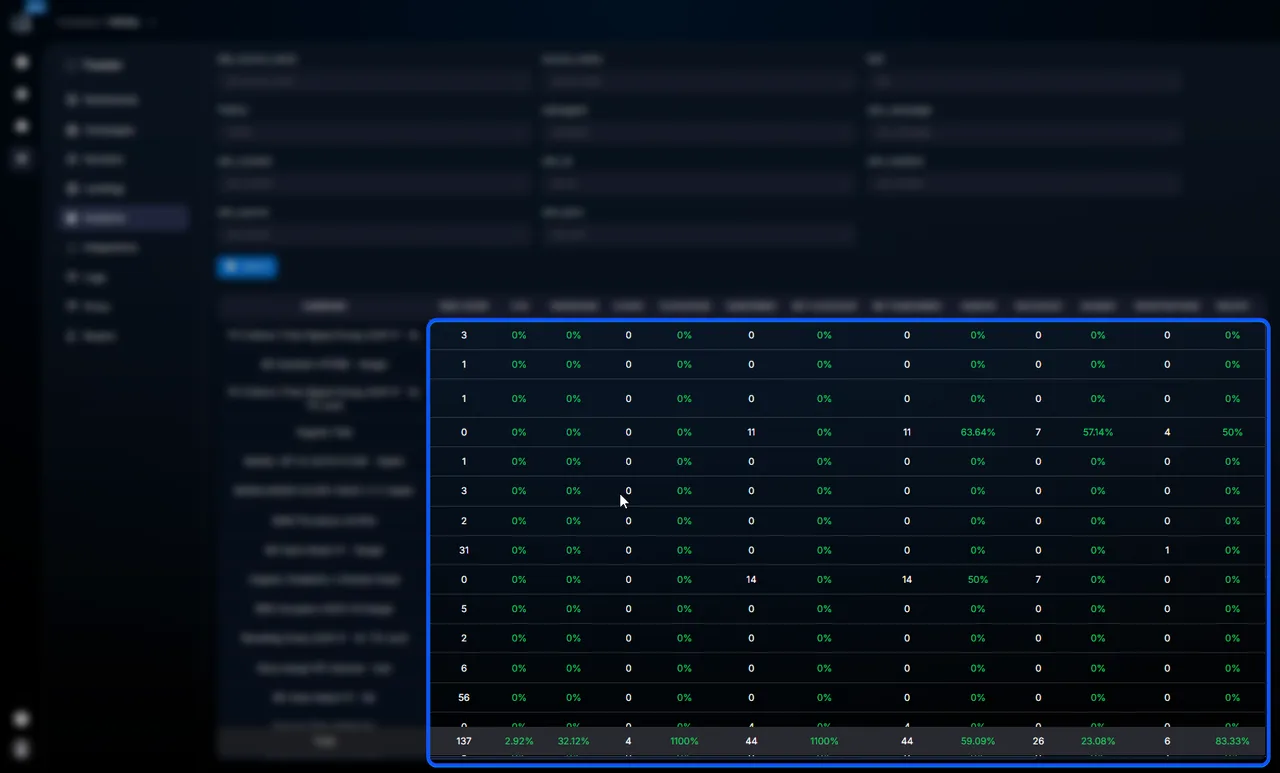
The top part is the KPI block (like on Dashboards). At the bottom is a table with a detailed breakdown by group. The Total row at the end is the sum of the selection.Optional — export


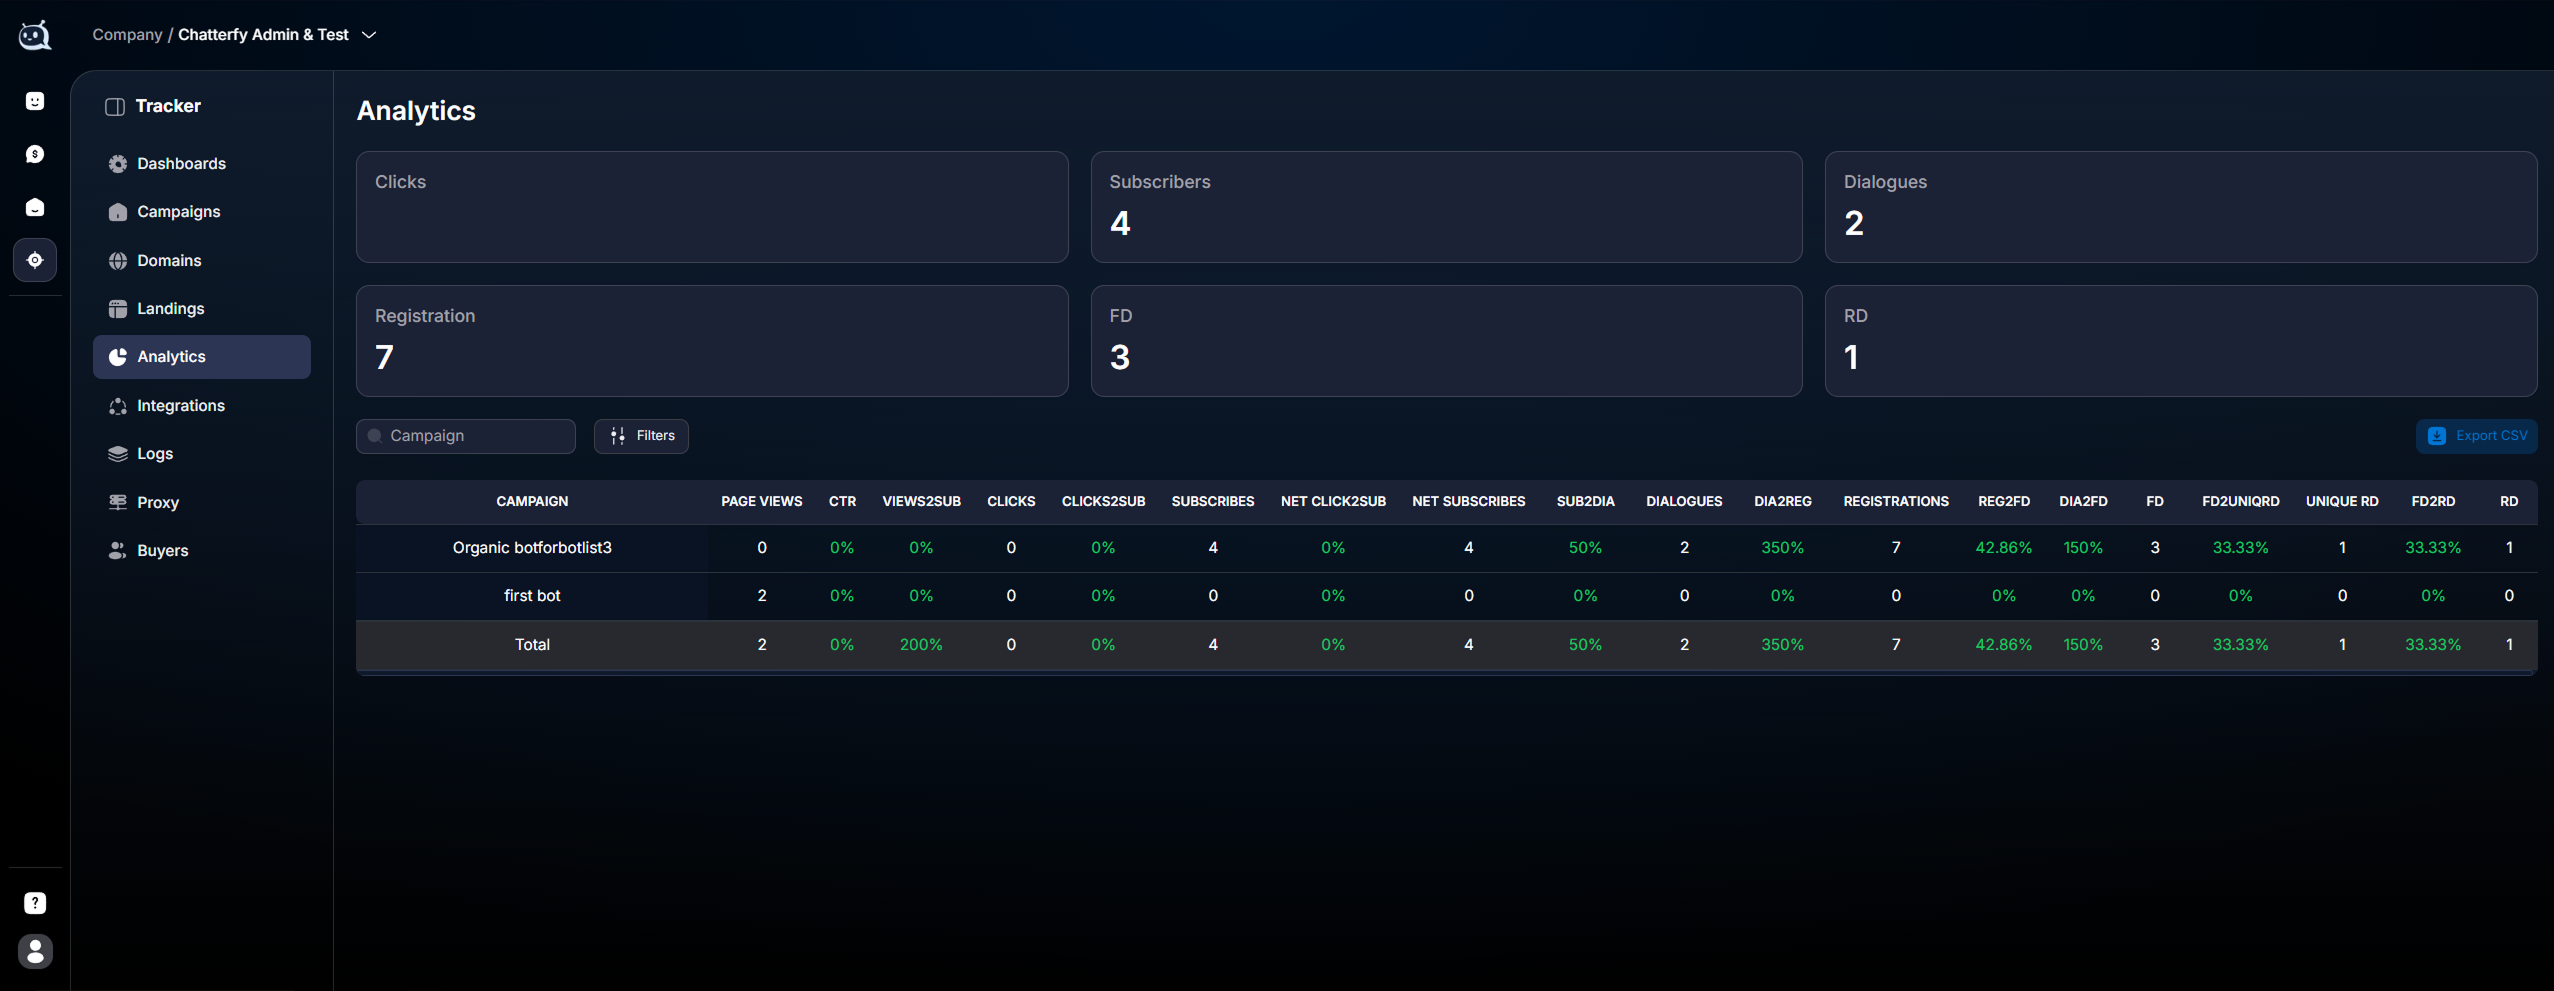
Main KPIs (top section)
Six KPIs, similar to those on Dashboards, but in Analytics they are complemented by a tabular breakdown based on the selected parameters.
Clicks — clicks on the button to proceed toTelegram.
- Subscribers — channel subscribers / those who started the bot.
- Dialogues — leads with a contact event (messaged the bot).
- Registration — registrations in the affiliate program.
- FD — first deposits.
- RD — recurring deposits (RD = total, Unique RD = number of unique recurring payers).
Table metrics
Traffic
Metric | What it shows |
|---|---|
PAGE VIEWS | Landing page opens. The top step of the funnel. |
CTR | Ratio of Page Views to Clicks. If CTR is low, there is a disconnect between the ad and the landing page. |
CLICKS | Clicks on the button to proceed to Telegram. An intentional action. |
Subscriptions
Metric | What it shows |
|---|---|
VIEWS2SUB | Conversion from Page Views → Subscribes. |
CLICKS2SUB | Конверсия Click → Subscribe. Разница с VIEWS2SUB показывает потери на этапе клика по кнопке. |
SUBSCRIBES | Total number of subscriptions. |
NET CLICK2SUB | Conversion by unique clicks, accounting for unsubscribes. |
NET SUBSCRIBES | Net subscriber growth (Subscribes − Unsubscribes). |
Dialogues and registrations
Метрика | Что показывает |
|---|---|
SUB2DIA | Subscribe → Dialogue conversion. Low = the bot is not capturing leads in direct messages. |
DIALOGUES | Number of users with a contact event. |
DIA2REG | Dialogue → Registration conversion. Depends on the quality of nurturing in the bot. |
REGISTRATIONS | Number of registrations in the affiliate program. |
Deposits
Метрика | Что показывает |
|---|---|
REG2FD | Registration → First Deposit conversion. Depends on the quality of the affiliate program and the offer. |
DIA2FD | End-to-end Dialogue → FD conversion (bypassing the intermediate Registration step). |
FD | Number of first deposits. |
FD2UNIQRD | Conversion of FD to Unique RD. The primary indicator of LTV. |
UNIQUE RD | Number of unique repeat payers. |
FD2RD | Conversion of FD to total RD. Shows the intensity of repeat deposits. |
RD | Total number of repeat deposits (one lead may have multiple RDs). |
Withdrawals
Analytics also displays withdrawal data if this event is sent to the Tracker. Select a period, campaign, or source, then use grouping to compare withdrawals in the required breakdown.
Withdrawal data considers the same filters as other indicators in the table. Therefore, for an accurate comparison, first set the same period and set of campaigns, then examine the Total row.
The
Total row at the bottom of the table contains summary values for the selected campaigns and applied filters.Use cases
Preparing a report for management — media buying
A Buyer Team Lead prepares a weekly report. In Analytics: period = 'last 7 days', Group By =
day, Filter = campaign_name = "Casino-DE". They get a table broken down by day: Page Views / Clicks / Subscribes / FD / RD. Export to CSV and copy to a presentation for management.Analyzing an A/B test — performance marketing
A sales agency tests two landing page versions. Filter =
campaign_name IN ("Test-A", "Test-B"). Group By = campaign_name. They see metrics for each version in one table: which one provides the best CTR and conversion to FD. They decide to keep the winning version.Investigating a drop — media buying
A Buyer noticed that yesterday's FD dropped by half compared to the day before. In Analytics: period = 'yesterday / day before yesterday', Group By =
source_name. They see that one of the sources (Facebook Source) dropped by 80%, while others are stable. They go to 'Logs — event log'Logs — event logs— Sources logs Facebook — and detect mass 'Invalid token' errors. They reissue the Pixel Access Token.Analysis by buyers — Buyer Team Lead
A Buyer Team Lead conducts a monthly call with the team. In Analytics: period = 'last month', Group By =
buyer. They see the results of each team member: who brought more FDs, who has the best conversion, and who is lagging behind. Based on this, they provide feedback.What to consider
Buyer видит только свои кампании. Buyer Team Lead — свои + команды. Owner / Admin — все. Если хочется передать Analytics клиенту — выгружайте CSV (внешний клиент не имеет доступа к
Tracker). Низкая выборка (< 100 кликов) даёт нестабильные конверсии — не делайте поспешных выводов на маленьких объёмах. События партнёрки имеют задержку 1-30 секунд от реального действия — для аналитики «прямо сейчас» это незаметно, но в первые минуты после действия данные могут быть неполными.FAQ
Section articles


Related


WITHDRAW — withdrawals
Колонка
WITHDRAW показывает сумму событий вывода по каждой кампании с учётом выбранных фильтров. Используйте строку Total внизу таблицы для итогового значения по текущей выборке.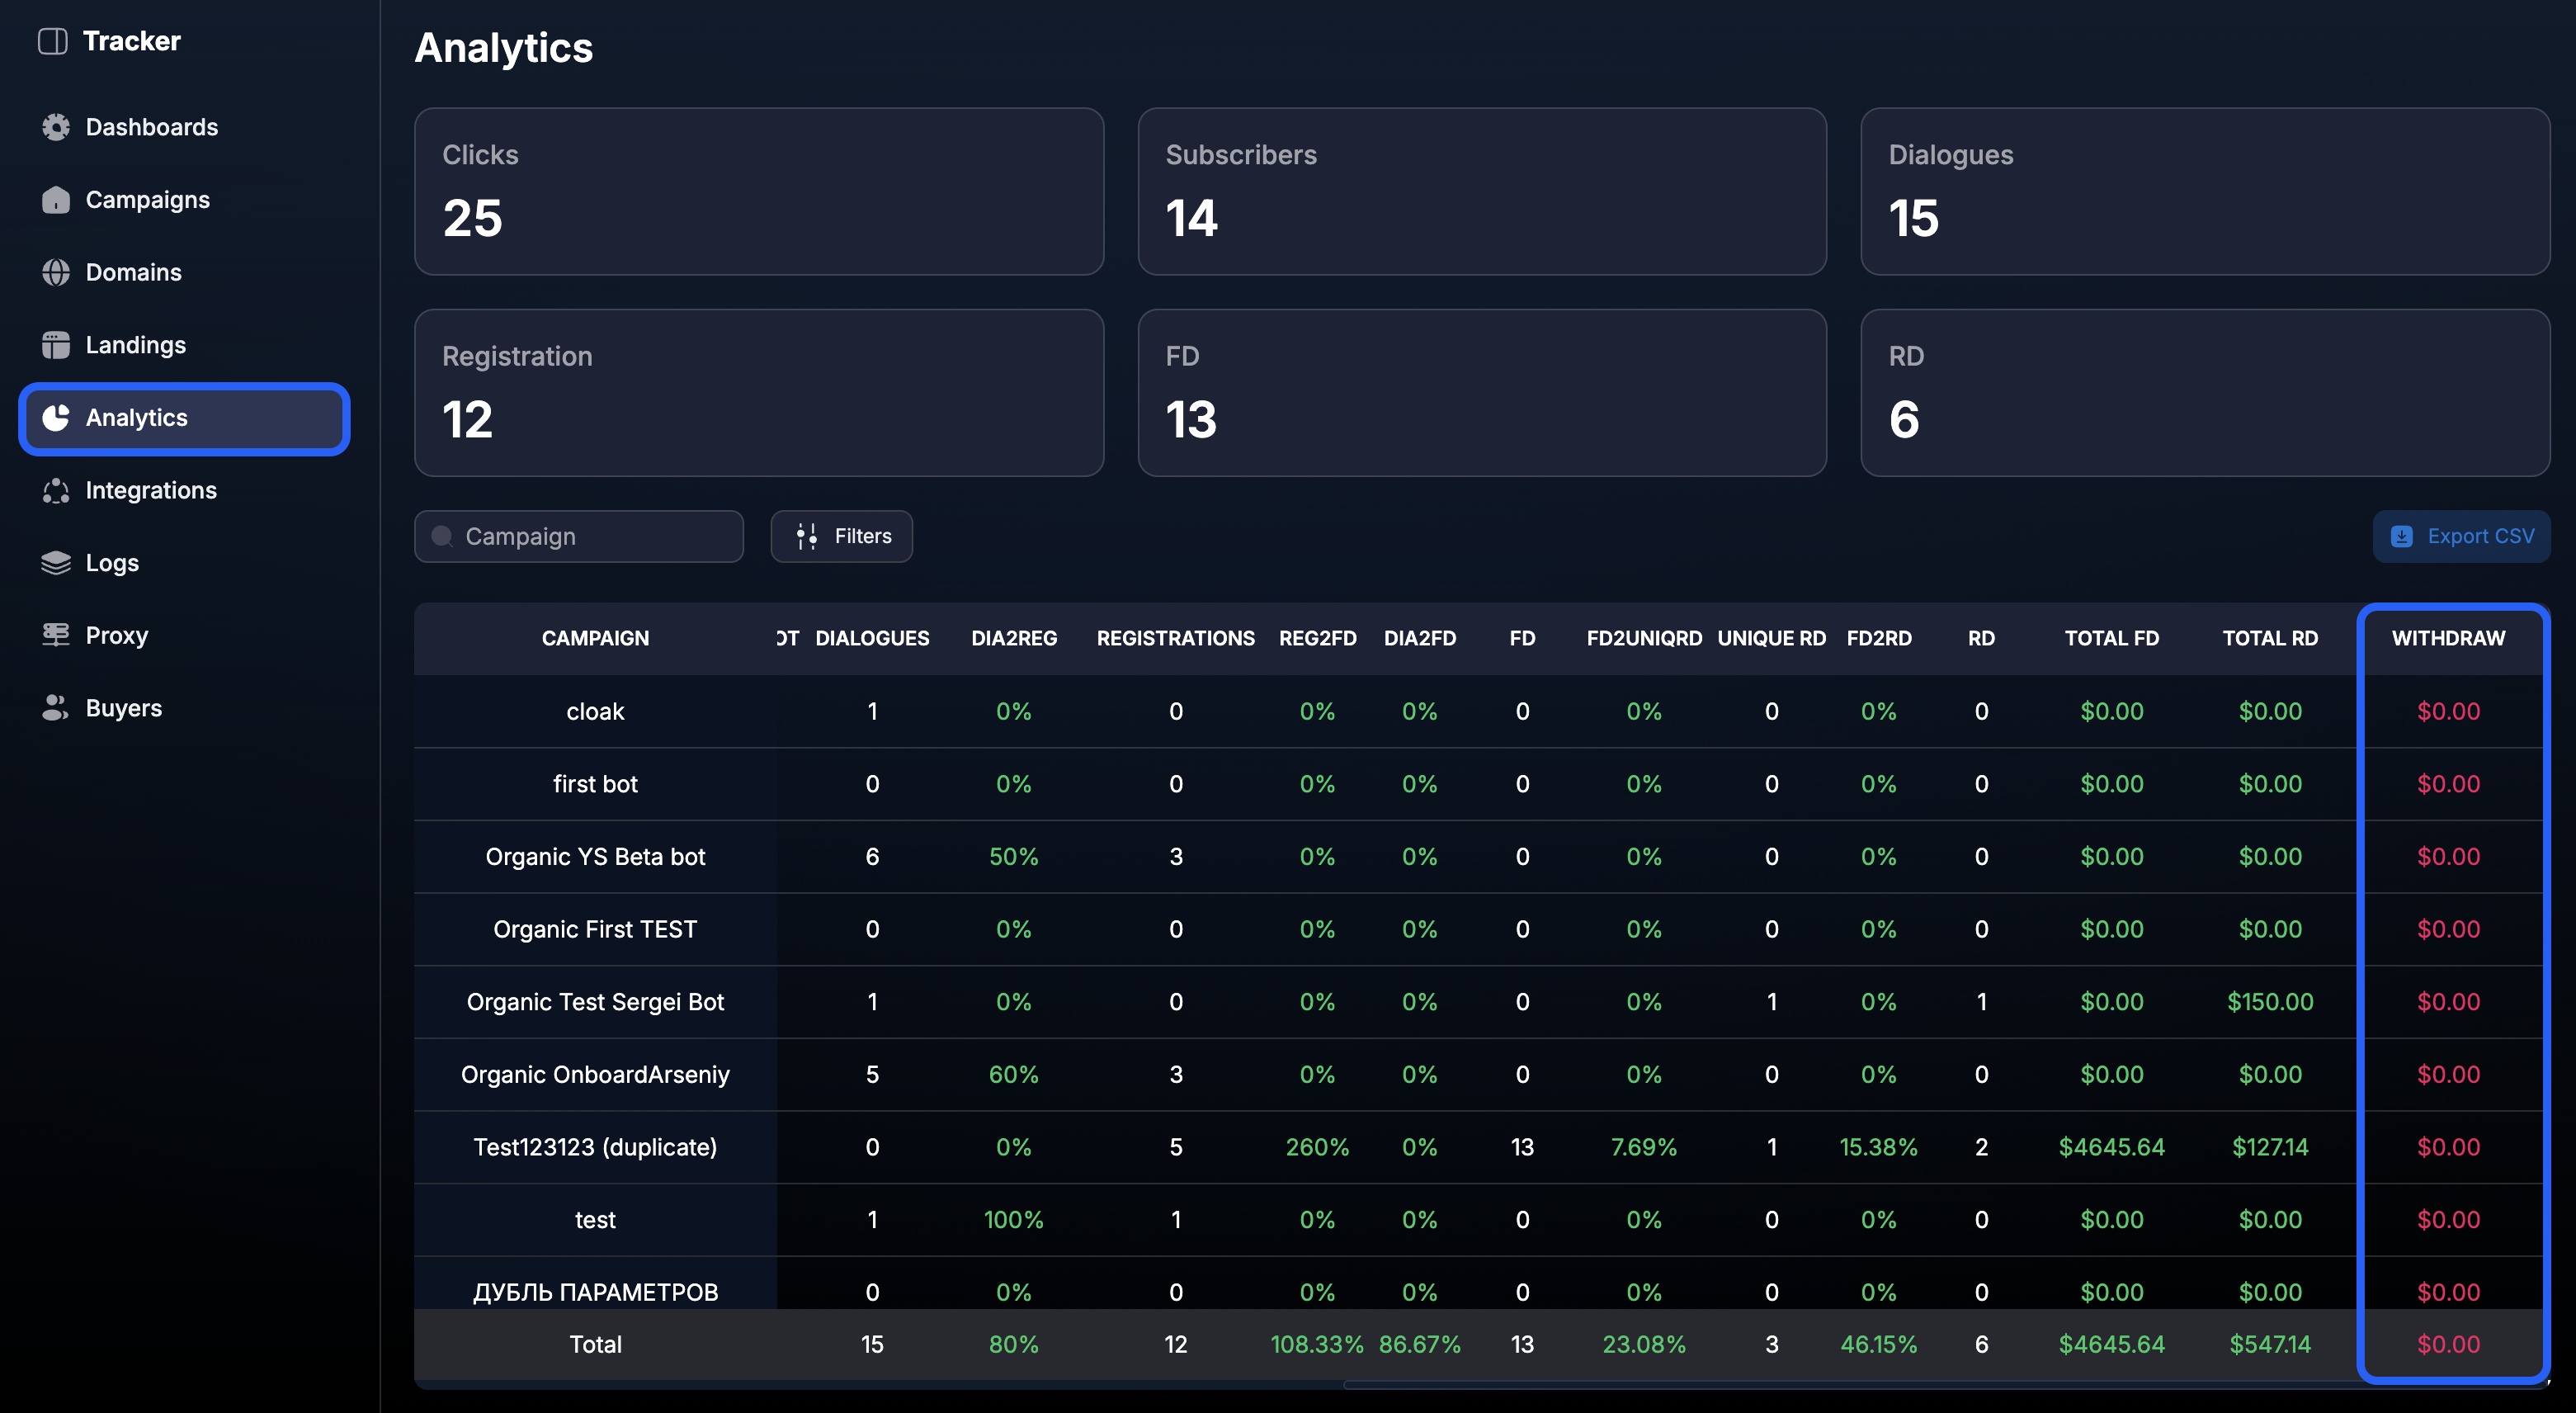
Was this article helpful?