

Filtering and grouping
Filtering is the main way to find the traffic segment you need in . Without filters, you see a general table for all of the user's campaigns — this is rarely useful for a specific question. With filte
Filtering is the main way to find the traffic segment you need in Analytics — detailed table. Without filters, you see a general table for all of the user's campaigns — this is rarely useful for a specific question. With filters, you quickly narrow it down to what you need: one campaign, one buyer, one creative, one GEO.
When to filter
Preparing a report for a specific campaign — use the
campaign_name filter. Comparing buyers' performance — Group By buyer. Looking for the best creatives — Group By ad_name. See an anomaly in Dashboards and want to dig deeper — add a filter + view by day. Preparing a CSV for a specific client — filter only their campaigns and export.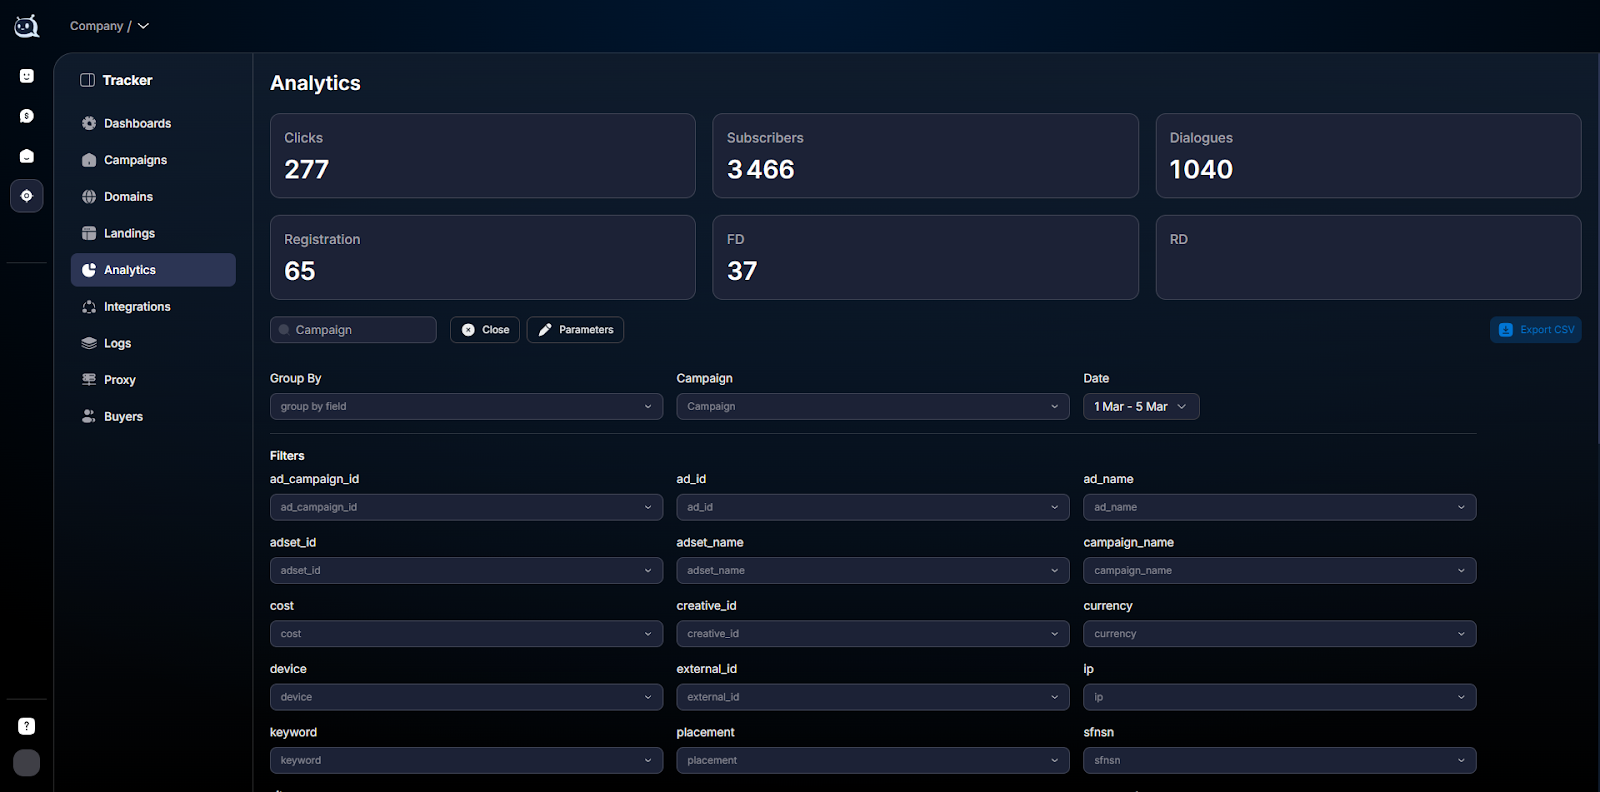
How it works
- — Narrow the dataset using filters by link, campaign, and date parameters.
- — Group data using Group By — the table shows a breakdown by the selected parameter.
- — Click Search — the table refreshes.
Filters and Group By work together. Filters narrow down what to show; grouping separates how to break it down. You can filter without grouping — you will get one overall total. Or you can group without filters — you will see all campaigns broken down by the selected parameter.
Which parameters you can filter by
The filters automatically show all parameters that are passed in your campaigns' tracking links. This depends on what is configured in Parameters — link parameters
A typical set:
- — campaign_name / ad_campaign_id — campaign in the ad account.
- — adset_id — a specific ad set.
- — ad_name — creative / ad.
- — placement — where it was placed (Stories, Feed, Reels).
- — utm_source, utm_campaign, utm_content — standard UTM parameters.
- — keyword — search phrase (Google Ads).
- — source_name — the Source name inside the campaign.
- — buyer — buyer.
- — any custom parameters that you added in.
Filters by campaign (a multi-selector for all your campaigns) and by date (period range) are also available.
Group By — statistics breakdown
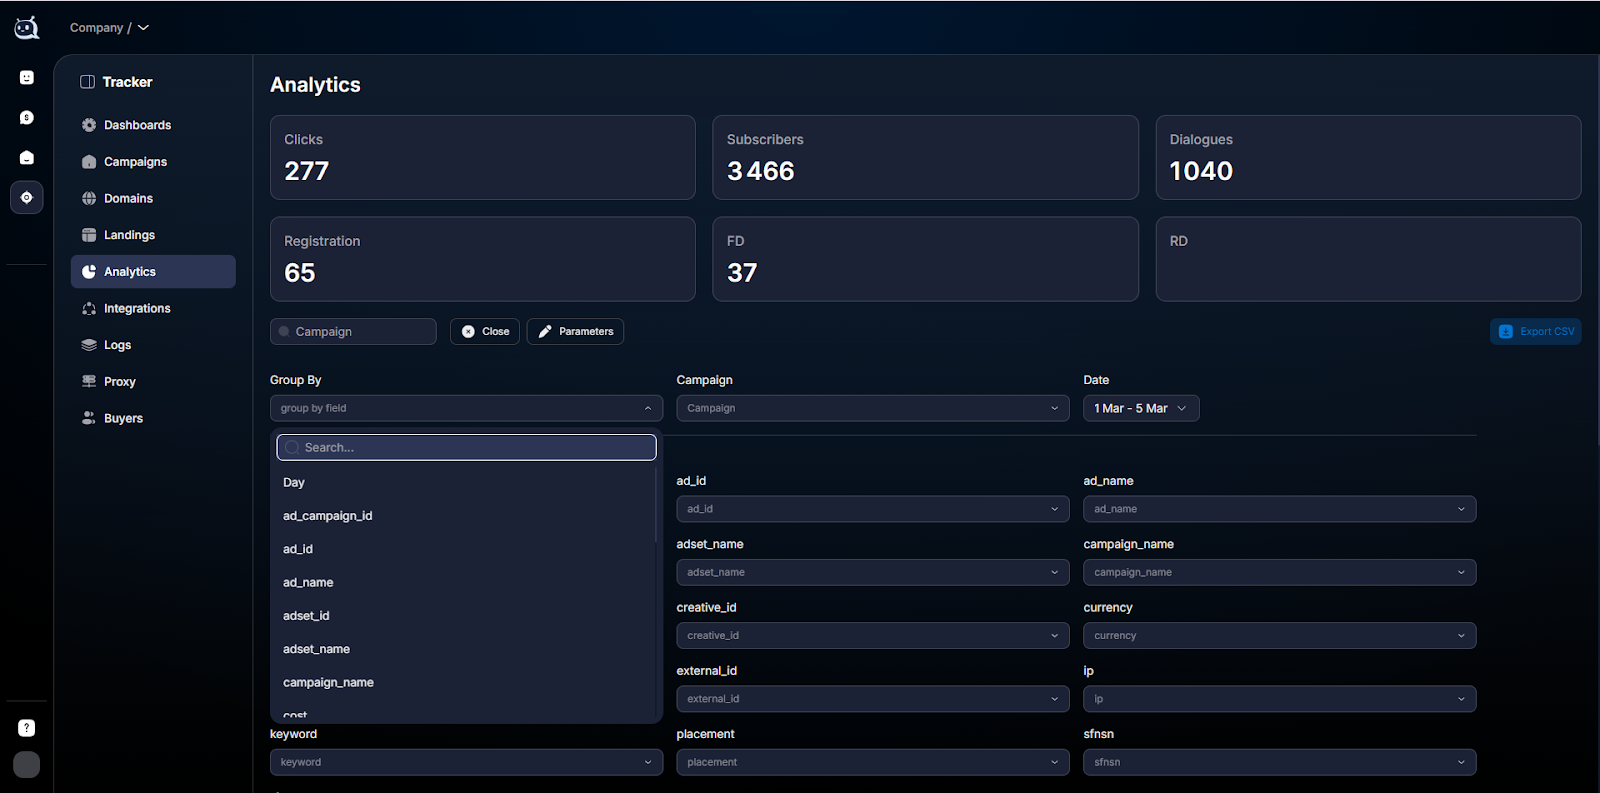
Group By groups the table by the selected parameter. Each unique combination of values = a separate row.
Available groupings:
- — Day — breakdown by day. Shows trends over time. The main breakdown for reports.
- — source_name — comparison of sources with each other.
- — ad_name / creative — comparison of creatives.
- — buyer — comparison of buyers (for Buyer Team Lead and Admin).
- — UTM tags and any custom parameters.
Steps to apply the filter


Open the Filters block
The button / expand arrow above the table. It is collapsed by default — expand it.Specify the filtering parameters
Select a parameter (for example,campaign_name) and a value (for example,"Forex-DE"). You can add several filters — they work via AND.Optionally — select Campaign / Date / Group By
TheCampaignparameter is a multi-selector for specific campaigns. Date is the date range. Group By is the table breakdown.Click Search
The table and metrics will update according to the selected conditions.Analyze
Review the results. If you need additional slices, adjust the filters and repeat.
Filters + Group By together
The most useful combination is filter first (what to show), then Group By (how to break it down). Examples:
Creative performance in one campaign
Filter:
campaign_name = "BlackFriday-US". Group By: ad_name. Result: the metrics for each creative within the campaign are visible. Compare CTR, CR to FD, and ROI.Comparing sources over a period
Filter:
Date = "Last 7 days". Group By: source_name. Result: metrics for each source (Facebook, Google, Telegram, Custom) — which has more FD and which source is cheaper.Day-by-day trend for a specific campaign
Filter:
campaign_name = "Forex-Q4". Group By: Day. Result: a table by day for the period. The trend is visible — increasing / decreasing.Finding an anomaly
Filter:
Date = "Yesterday", source_name = "FB-Source-1". Group By: hour (if this grouping is available). Result: you can see at which hour of the day the drop occurred — for example, after 18:00 events stopped coming in.Usage examples
Comparing buyers in the team — Buyer Team Lead
Buyer Team Lead opens Analytics. Filter:
Date = Last 30 days. Group By: buyer. They see each team member’s results for the month: who brought in more FD, who has the best REG2FD, and who has the worst CTR. They discuss this with the team on the weekly call.Analyzing ad_name × placement — performance marketing
A sales agency is driving e-commerce traffic. It wants to understand which creative works best on which Facebook placement. Filter:
campaign_name = "Shoes-Sept". Group By: ad_name (but Tracker allows one grouping). They run two passes — first Group By ad_name (to find the best creative), then add ad_name = "best" to Filter and Group By placement — to find the best placement.Finding missing postbacks by clickid — affiliate arbitrage
A buyer is trying to understand why the lead Ivan (clickid
abc123) did not receive FD. Filter: clickid = abc123. They see the full history for this lead in Analytics — Page View OK, Click OK, Subscribe OK, Contact OK, but Registration / FD are missing. They go to Logs — event logs with the same clickid — there you can see incoming postbacks or their absence.What is important to consider
Filters work via AND — multiple filters narrow the results more strictly. For OR logic (for example, “creative_v3 OR creative_v4”) — use the value multi-selector or several separate queries. Group By works with one parameter at a time — for double grouping, run several passes or export to CSV and group in Excel. Parameters appear in filters automatically, but data must have been collected — if you have just added a Parameters — link parameters new one, it will appear in filters only after the first clicks.
FAQ
Related


Was this article helpful?