

Dashboards — Summary Analytics
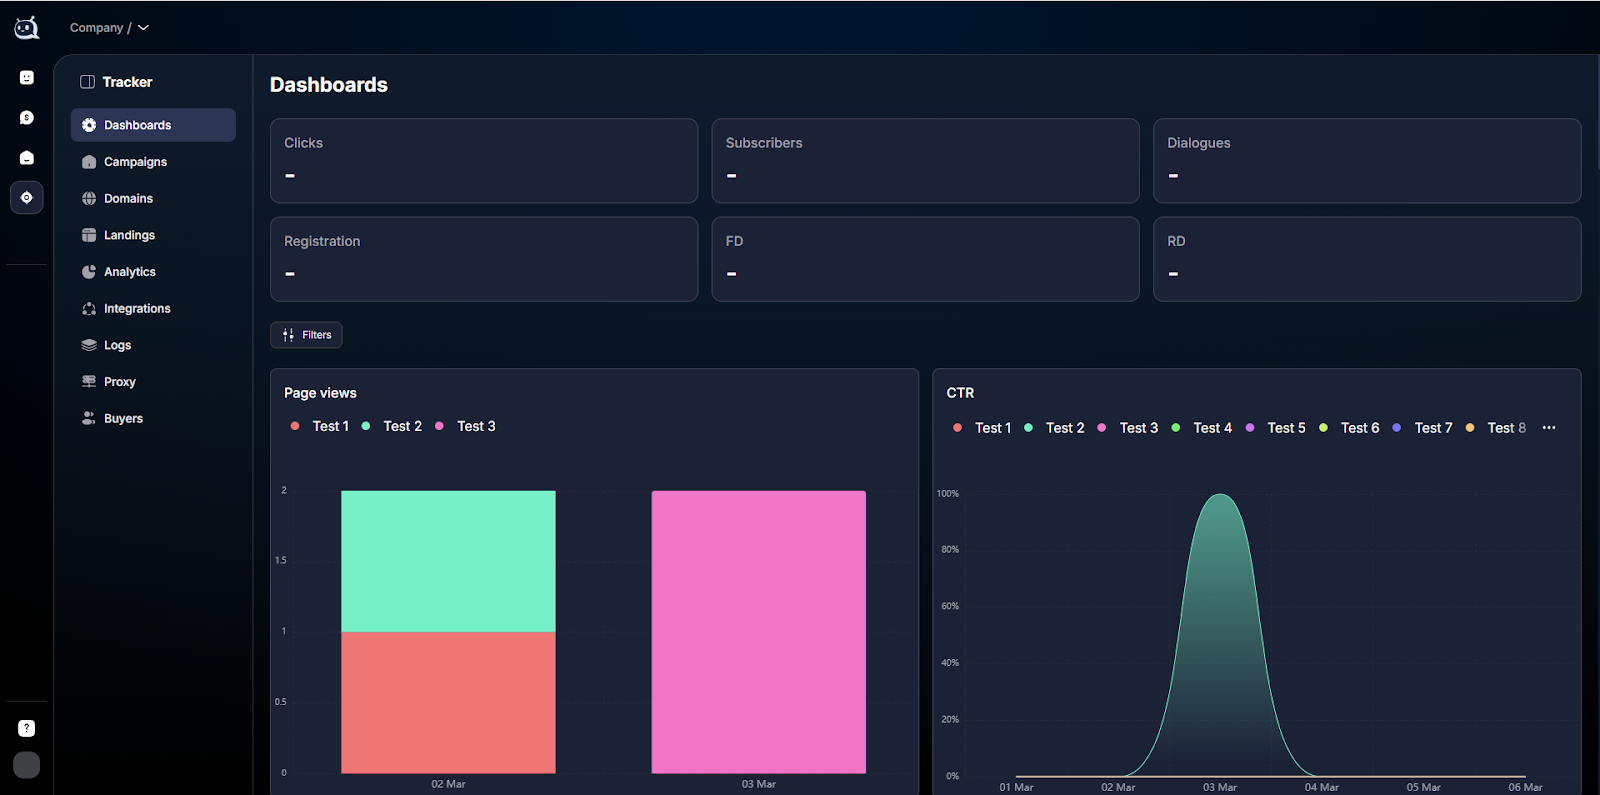
The Tracker → Dashboards section is a quick monitoring screen. Six key metrics at the top and funnel charts from click to repeat deposit at the bottom. It opens in 2 seconds and immediately answers th
The Tracker → Dashboards section is a quick monitoring screen. Six key metrics at the top and funnel charts from click to repeat deposit at the bottom. It opens in 2 seconds and immediately answers the question “how are things today?”
If Analytics — detailed tableis a table for in-depth analysis, Dashboards is an indicator panel for a daily check. Metrics and charts are on one page, filters are one click away.
When to open Dashboards
Morning check: “how traffic is doing today compared to yesterday.” Monitoring during traffic launch: watch CTR and conversions in real time, and quickly disable ads that are not working. Compare two campaigns / sources for a period through Filters. Prepare a short report for a manager or client — a Dashboards screenshot says more than a long text. Find anomalies: something changed — which part of the funnel dropped.
What’s inside


— How to Filter Dashboards— instructions for filtering and grouping: how to build a slice for a specific campaign, source,
buyer, ad_name, and so on.— Analytics — detailed table— a detailed table with the same metrics, but grouped by day and link parameters + export to CSV. Use Analytics when Dashboards is no longer enough.
Key metrics (top section)
Six KPIs that are always visible without a click:
Clicks — clicks on the button that takes the user toTelegramon the landing page. This is no longer aPage View, but a deliberate user action.
- Subscribers — subscriptions to a channel or bot starts. The lead’s first registration in the
Telegramreceiver.
- Dialogues — users who wrote to the bot or in private messages (contact event). This is the first “full-fledged” lead — without contact, postbacks from the affiliate network are not linked.
- Registration — registrations in the affiliate program. They arrive via postback.
- FD — first deposits (First Deposit). The main target event in affiliate arbitrage.
- RD — repeat deposits (Re-Deposit). One lead can make multiple RDs. View this together with Unique RD (the number of unique repeat payers).
Funnel charts (bottom section)
Below the KPIs are charts broken down by funnel stage. Each shows absolute volume and conversion between steps.
Traffic
— Page Views — landing page opens.
— CTR — the ratio of
Page Views to Clicks. A low CTR indicates a weak “ad ↔ landing page” combination: either the promise in the ad does not match what is on the landing page, or the landing page does not lead users to the transition button well enough.Subscriptions
—Views → Sub— conversion from a view to a subscription.
—Clicks → Sub— conversion from a click to a subscription. If there is a large gap versus
Views → Sub— users click but do not subscribe (they do not confirm joining the channel, or the channel does not open).—Subscribes / Unsubscribes / Net Subscribes— subscription and unsubscription dynamics. Net Subscribes = Subscribes − Unsubscribes for the period.
—Net Clicks → Sub— conversion based on unique clicks, taking unsubscribes into account.
Dialogues and registrations
—Sub → Dia / Dialogues— transition from subscription to dialogue. A low rate means the bot is not messaging leads or the DM bot is not active.
—Dia → Reg / Registrations— transition from dialogue to registration in the affiliate program. It depends on the quality of nurturing in the chat — this is the work of
CRM (see Статья).Deposits
—Reg → FD / FD— conversion from registration to first deposit.
—Dia → FD— end-to-end conversion from dialogue to deposit (bypassing the “intermediate” Reg as a metric).
—FD → Uniq RD / Unique RD— transition to unique repeat deposits. The main LTV metric.
—FD → RD / RD— transition to the total number of repeat deposits.
Where to check what dropped
The funnel is read from left to right. If total revenue is falling, look at which stage has the biggest “leak”:
—CTR dropped→ the problem is between the ad and the landing page (new creative, audience changed, landing page does not match).
—Clicks → Sub dropped→ the channel does not open, Invite Bot is not active, or the transition UX in
Telegram is changing.—Sub → Dia dropped→ the DM bot is not active or the Flow is not starting for new leads.
—Dia → Reg dropped→ the bot handles the dialogue poorly (check
AI Reply and message texts), or the registration link returns a 404.—Reg → FD dropped→ the affiliate program is not verifying the deposit, or leads are not completing the payment (a poor offer for the geo).
—FD → Uniq RD dropped→ poor retention on the affiliate program side, or leads try it once and leave.
Use cases
Daily check — arbitrage
A buyer opens Dashboards in the morning. Sees:
Clicks yesterday = 1200 (normal), but Dialogues = 80 (normal is 200). The Sub → Dia chart shows a drop — something is wrong with the bot. Checks Tracker → Logs, sees that the DM bot went down last night because the token changed. Restarts it, and events start coming in.Source comparison — arbitrage
Buyer Team Lead opens Dashboards with a filter for two sources (Facebook vs
Telegram). They see that Facebook delivers an 8% CTR, while Telegram delivers 3%, but Telegram results in Reg → FD = 25% versus 12% for Facebook. They decide to increase the budget for the Telegram source, even though it has less traffic.Client summary — sales agency
A performance agency manages an e-commerce client in
Telegram. Once a week, Admin takes a screenshot of Dashboards filtered by a specific buyer (= client) and inserts it into the report. The KPI and charts speak for themselves — no long text is needed.Important considerations
Dashboards updates in real time, but affiliate network events arrive with a delay of 1–30 seconds. If you have just sent a postback, wait a minute. A small sample size (few clicks during the period) produces unstable conversions — with 50 clicks, the percentage jumps around and is hard to interpret. Compare periods with comparable traffic volume. Buyer sees only their own data; Buyer Team Lead sees team data (see Buyers — Buyers and Team Leads).
FAQ
Articles in this section
Related


Was this article helpful?