

Exporting Data to CSV
CSV export is a way to download the current analytics slice to a file and work with it outside Tracker. CSV opens in Excel and Google Sheets, can be imported into BI tools (Power BI, Tableau, Yandex D
CSV export is a way to download the current analytics slice to a file and work with it outside Tracker. CSV opens in Excel and Google Sheets, can be imported into BI tools (Power BI, Tableau, Yandex DataLens), and can be processed with Python / R scripts for in-depth analytics.
When to export
You are preparing a report for management / a client and need numbers in Excel format. You are combining data from Tracker and other systems (CRM, billing) and Excel or BI handles the merge. You are analyzing trends over a long period (3+ months): the table in Tracker may be slow, while CSV processing in Excel is faster. You are sending data to an accountant for tax reporting on partner revenue. You are archiving data: Tracker stores history for a long time, but CSV gives you an offline copy. You are preparing a presentation: build charts in Excel / Google Sheets from the CSV.
How it works
The file is downloaded through the browser (standard download dialog). The file name usually contains the export date and a description (for example,
analytics_2026-05-07.csv). The content is UTF-8, and the delimiter is a comma (standard CSV).Export steps
Open Analytics
Tracker → Analytics. A table with overall statistics will load.Configure the slice
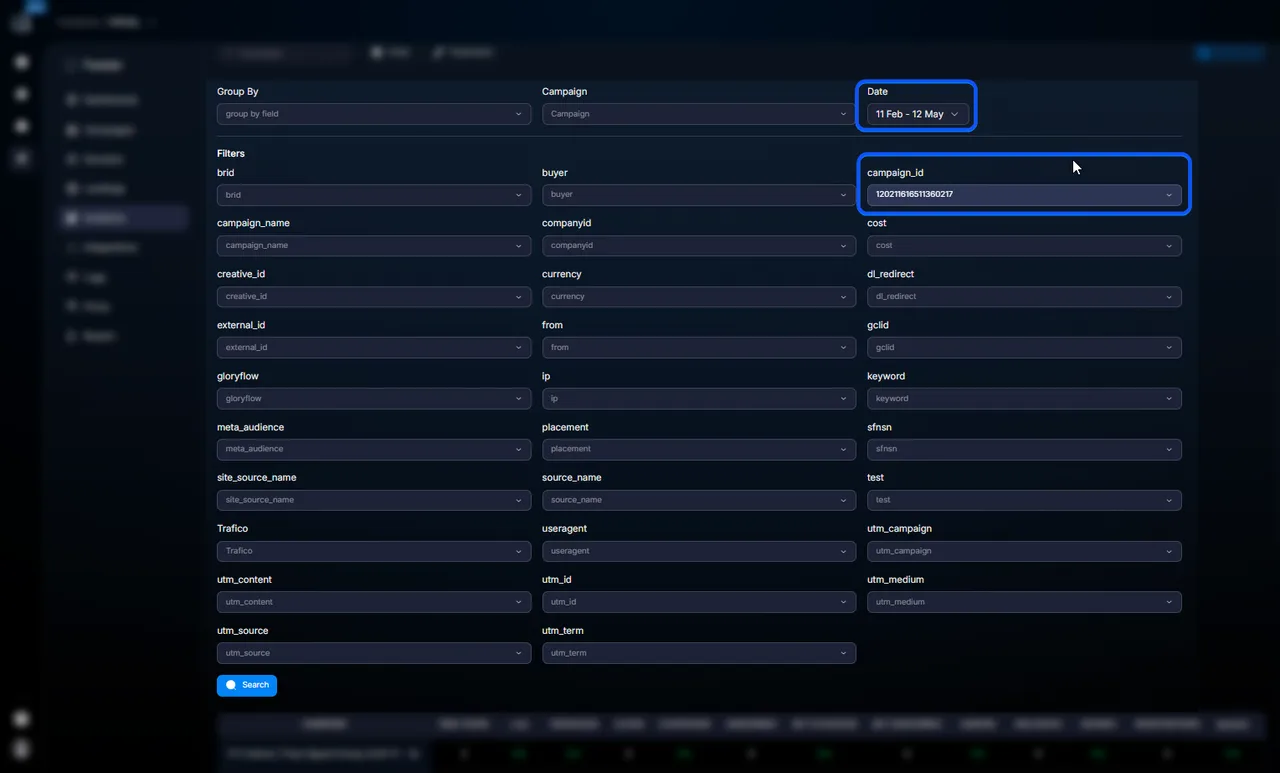
Apply the required filters using Filtering and grouping, select the period, select Group By. Click Search — the table will update.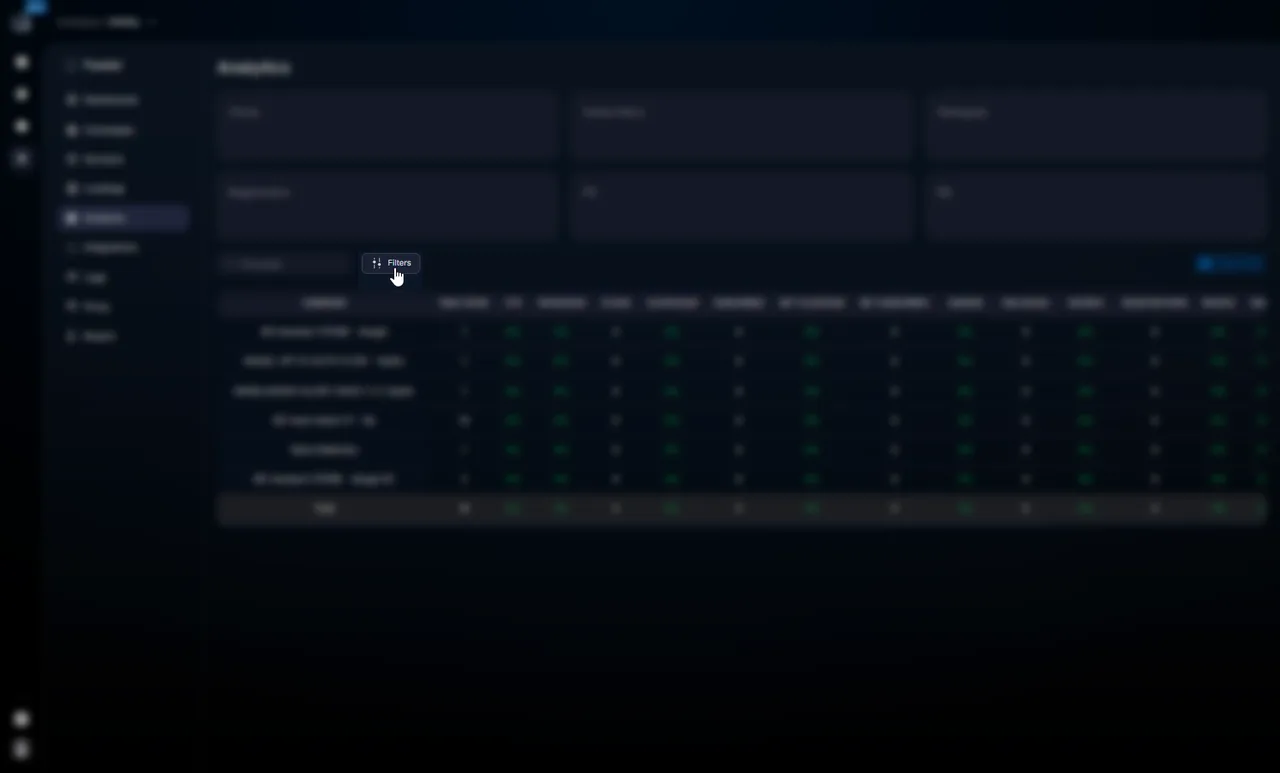
Check the table
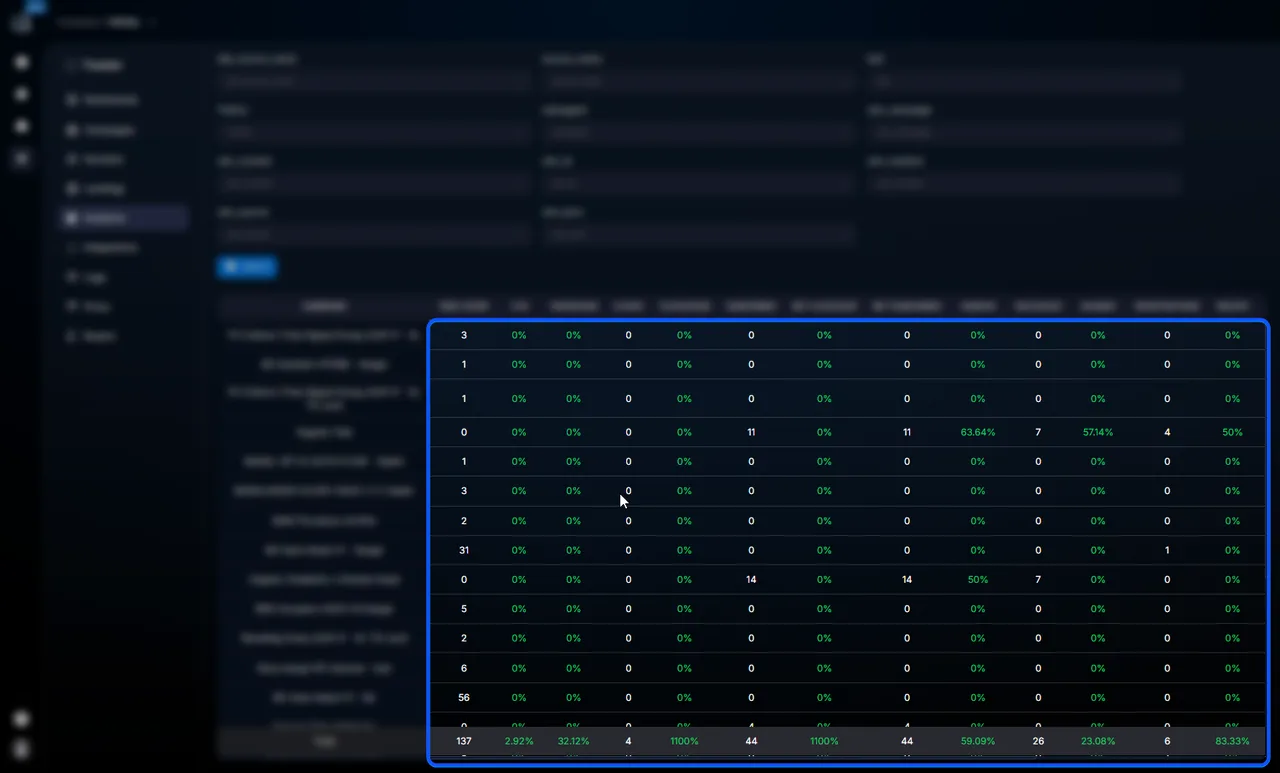
Make sure the table contains exactly the data you want to export. Do not forget about the Total row — it will also be included in the CSV.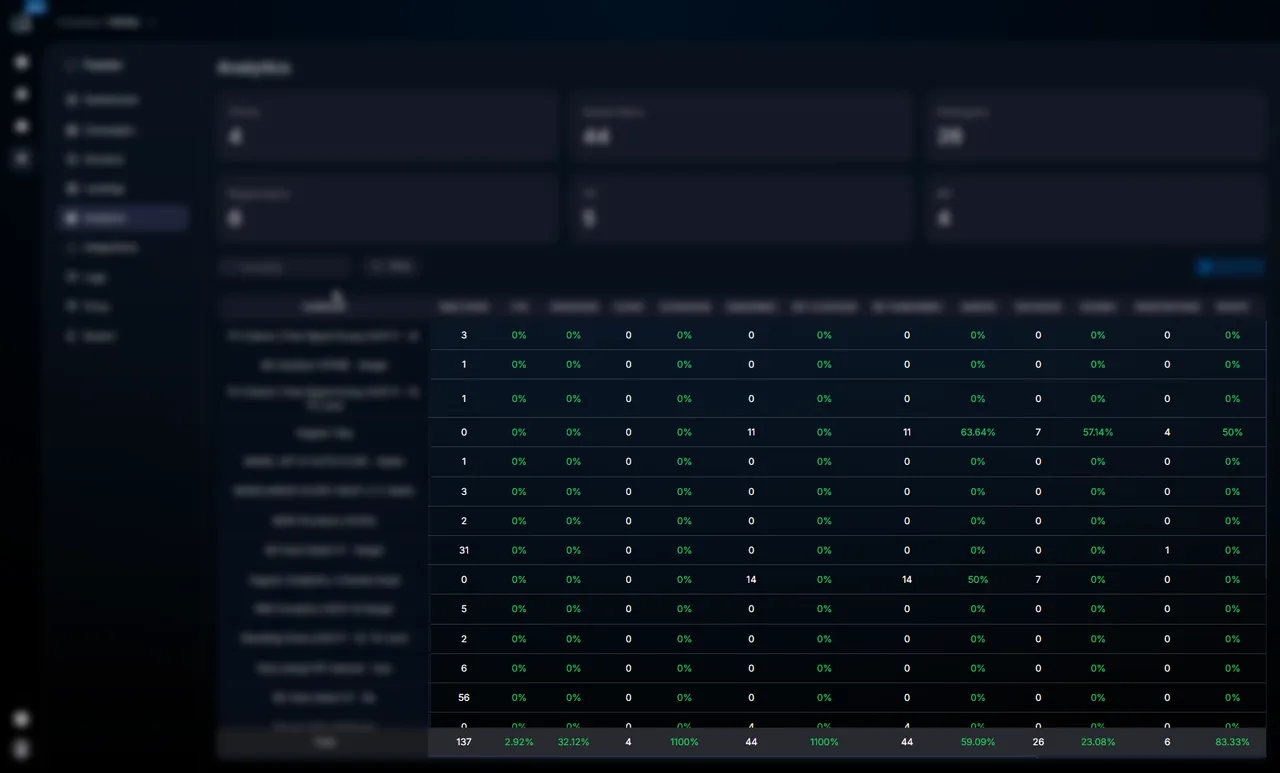
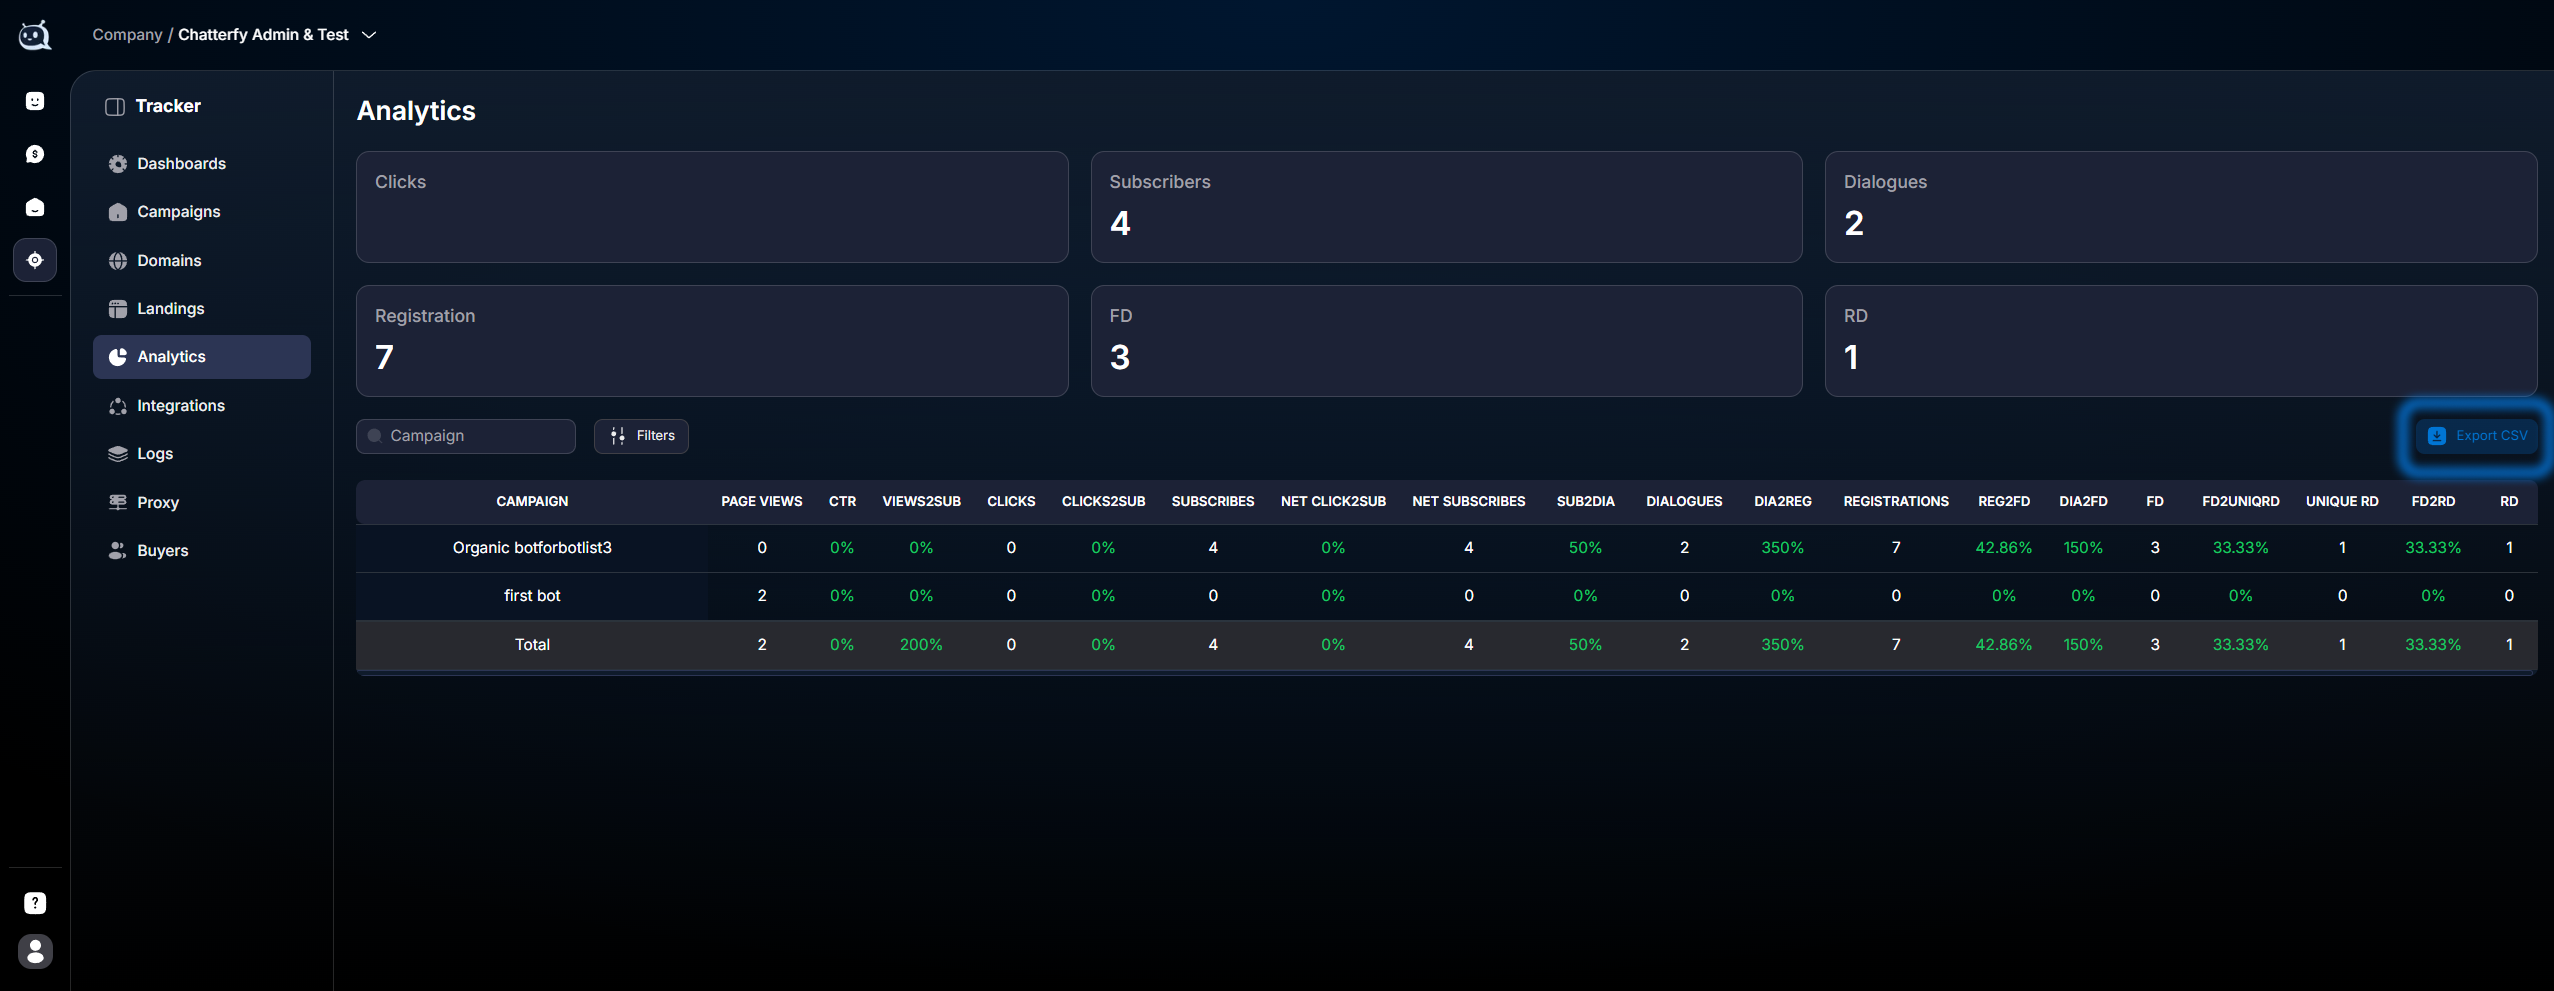
Click Export CSV
The button is usually in the upper-right corner of the table. The browser will download the file.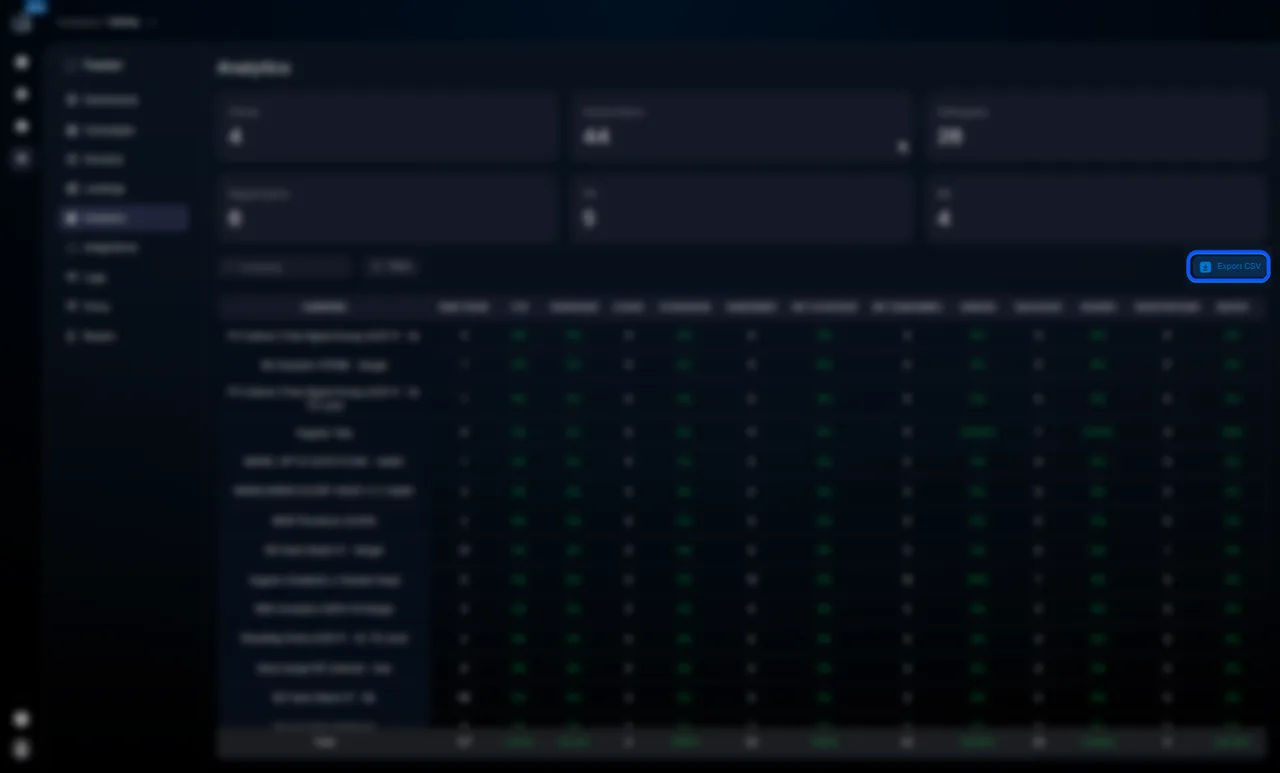
Open it in Excel / Google Sheets
Double-click the file and it will open in the system application. For Excel, you may need to specify Encoding = UTF-8 and Delimiter = Comma during import so that Cyrillic characters are displayed correctly.


What will be included in the file
The CSV contains:
- — All columns of the current table (Page Views, CTR, Clicks, Subscribes, Dialogues, Registration, FD, RD, Unique RD, and so on).
- — The grouping parameter (Day, source_name, ad_name, buyer — whatever was selected in Group By).
- — All table rows — each unique combination of values.
- — The Total row — total values for the entire slice.
What is not included:
- — Charts (this is a table, not a visualization).
- — Information on specific leads (each lead’s clickid) — this is summary statistics. For lead details —.
- — Campaign names / IDs — only metrics and grouping by the selected parameter.
Usage examples
Monthly report for management — arbitrage
The Buyer Team Lead prepares a monthly report. In Analytics: Date = "Last 30 days", Group By =
Day. Export CSV. Opens it in Excel, builds a chart of FD dynamics by day, and copies it into a presentation. On the call with the CEO, shows the dynamics + summary.CSV for the accountant — arbitrage
The Buyer exports revenue data for tax accounting. Filter:
Date = "January 2026". Group By = Day. Export CSV. The accountant uses the FD and Unique RD columns to compile monthly revenue data from the affiliate program.Importing into BI — performance marketing
The performance agency imports Tracker data into Yandex DataLens to build dashboards for clients. Every week, in an automated workflow (via manual CSV export → upload to DataLens). When an API for direct integration becomes available, they will switch to it.
Cohort analysis — sales
The sales agency analyzes how LTV changes for leads from different months. For each month, they create a separate CSV export (Filter Date = month + Group By
campaign_name). In Excel, they combine all periods into one pivot table — the cohort dynamics FD → Unique RD are visible.What to keep in mind
The CSV contains only what is in the current table. If the filters are incorrect, the file will contain the wrong data. Check the table before exporting. Very large selections (thousands of rows) may take a long time to generate. For huge volumes, split them into several smaller exports. Encoding is UTF-8 — it opens correctly in modern programs. If Cyrillic characters in Excel appear as “?”, open the file via File → Open and select “UTF-8” during import. Excel may reformat dates — if the CSV date is
"2026-05-07", Excel may convert it to its own format. Use Google Sheets or specify the format during import.FAQ
Related


недоступна

Was this article helpful?