

Logs — event logs
Open Tracker → Logs. In the upper part of the page, four logs are available: postback sends, source events, S2S requests, and the Tracker object change history. To search for a single chain, use the s
Open Tracker → Logs. In the upper part of the page, four logs are available: postback sends, source events, S2S requests, and the Tracker object change history.
To search for a single chain, use the same Click ID in several tabs. This makes it easier to understand at what stage the event was received, sent, or rejected.
Postbacks logs — sending postbacks
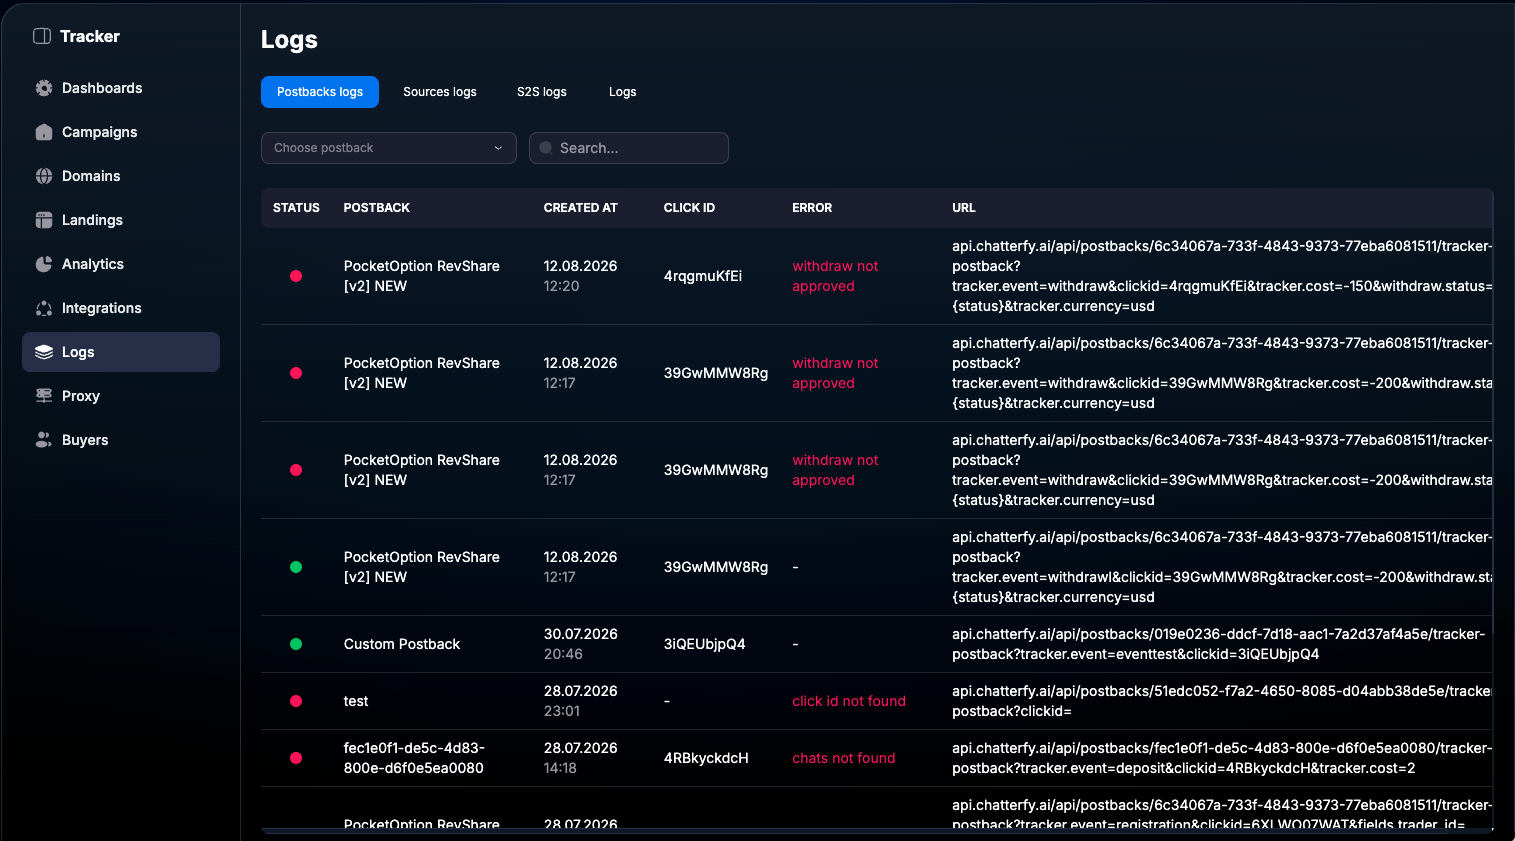
The Postbacks logs tab shows requests that Tracker sends to external systems based on configured postbacks. It is useful here to check whether the request was generated and why the recipient might have rejected it.
Filters
Select the required postback in the Choose postback field or use the search to find a record by name, Click ID, error, or part of the URL.
What the table shows
Status — send result; Postback — settings name; Created At — request time; Click ID — click identifier; Error — error reason; URL — actual request address with all parameters.
A red status means that the request ended in an error. First, check the text in the Error column and the parameters in the URL.
Sources logs — source events
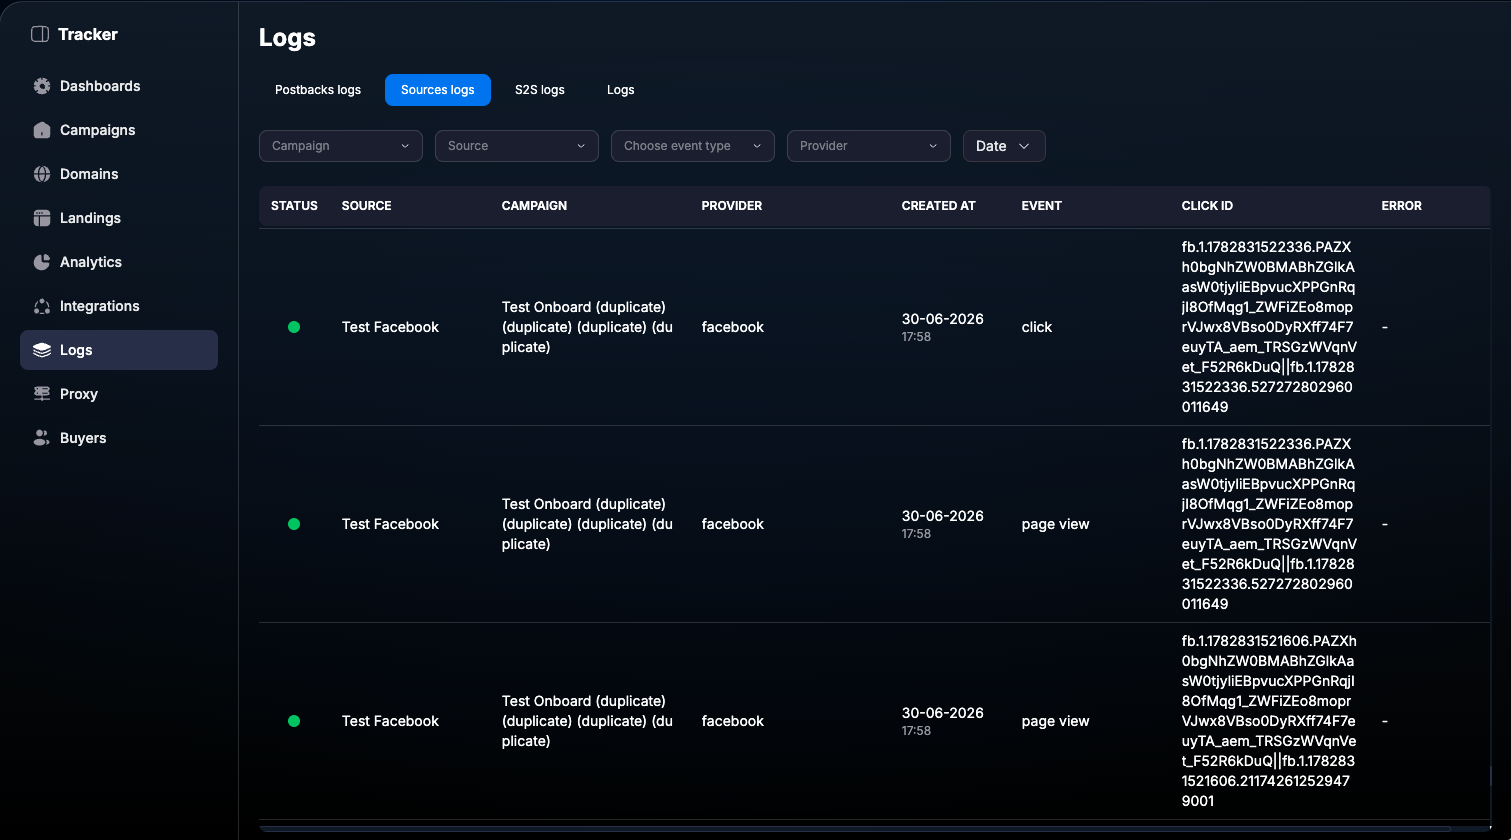
The Sources logs tab contains events related to advertising sources and campaigns. It helps to verify that a click or page view has been received, matched with a campaign, and processed by the required provider.
Filters
Narrow down the results by campaign, source, event type, provider, and date. A combination of filters is useful when there are many similar events in the log.
What the table shows
Status — processing result; Source — source; Campaign — associated campaign; Provider — advertising system; Created At — time; Event — event type; Click ID — click identifier; Error — error message.
S2S logs — server requests
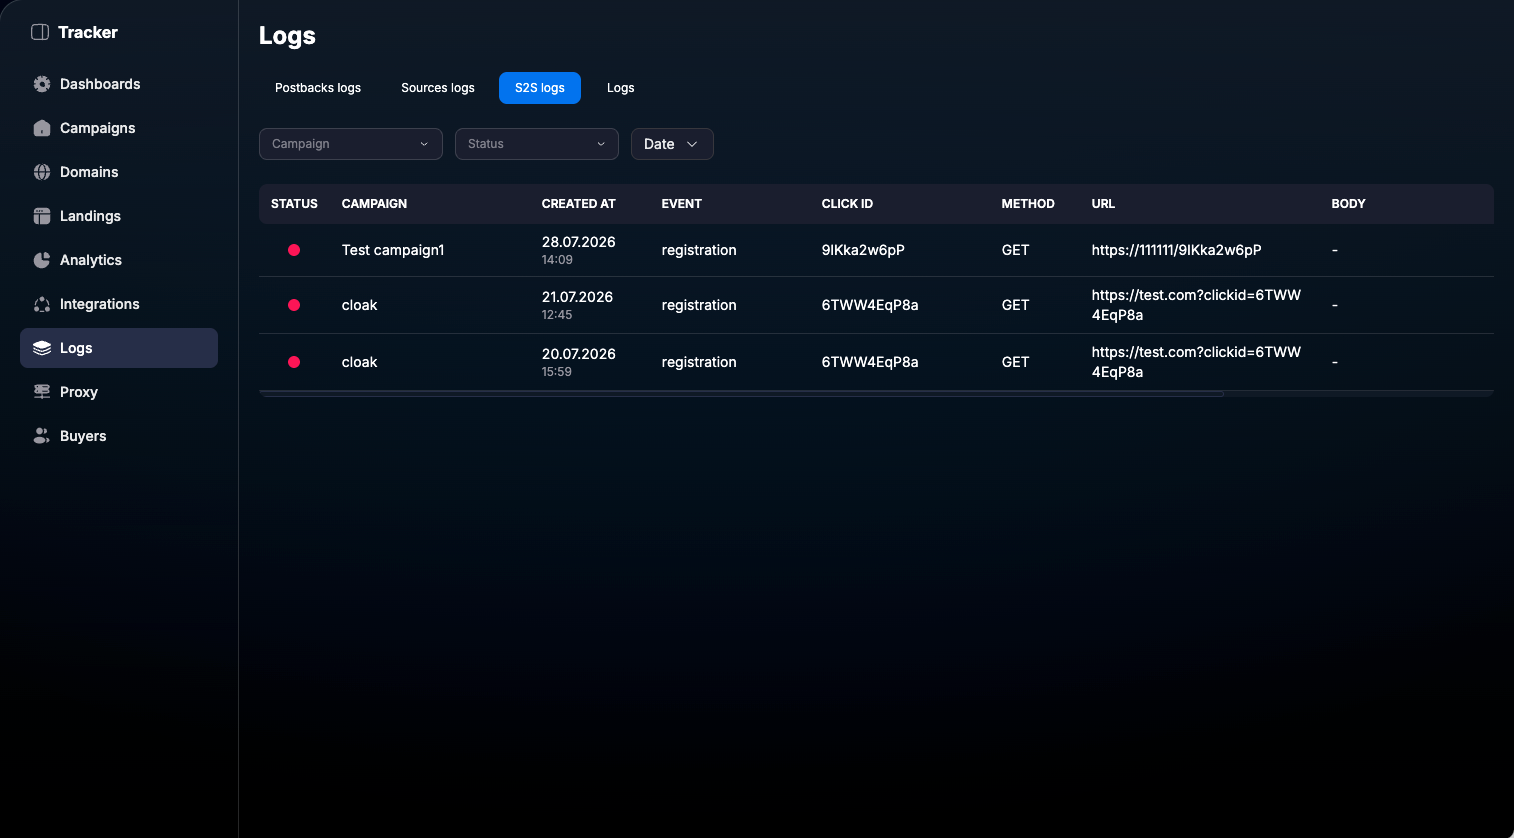
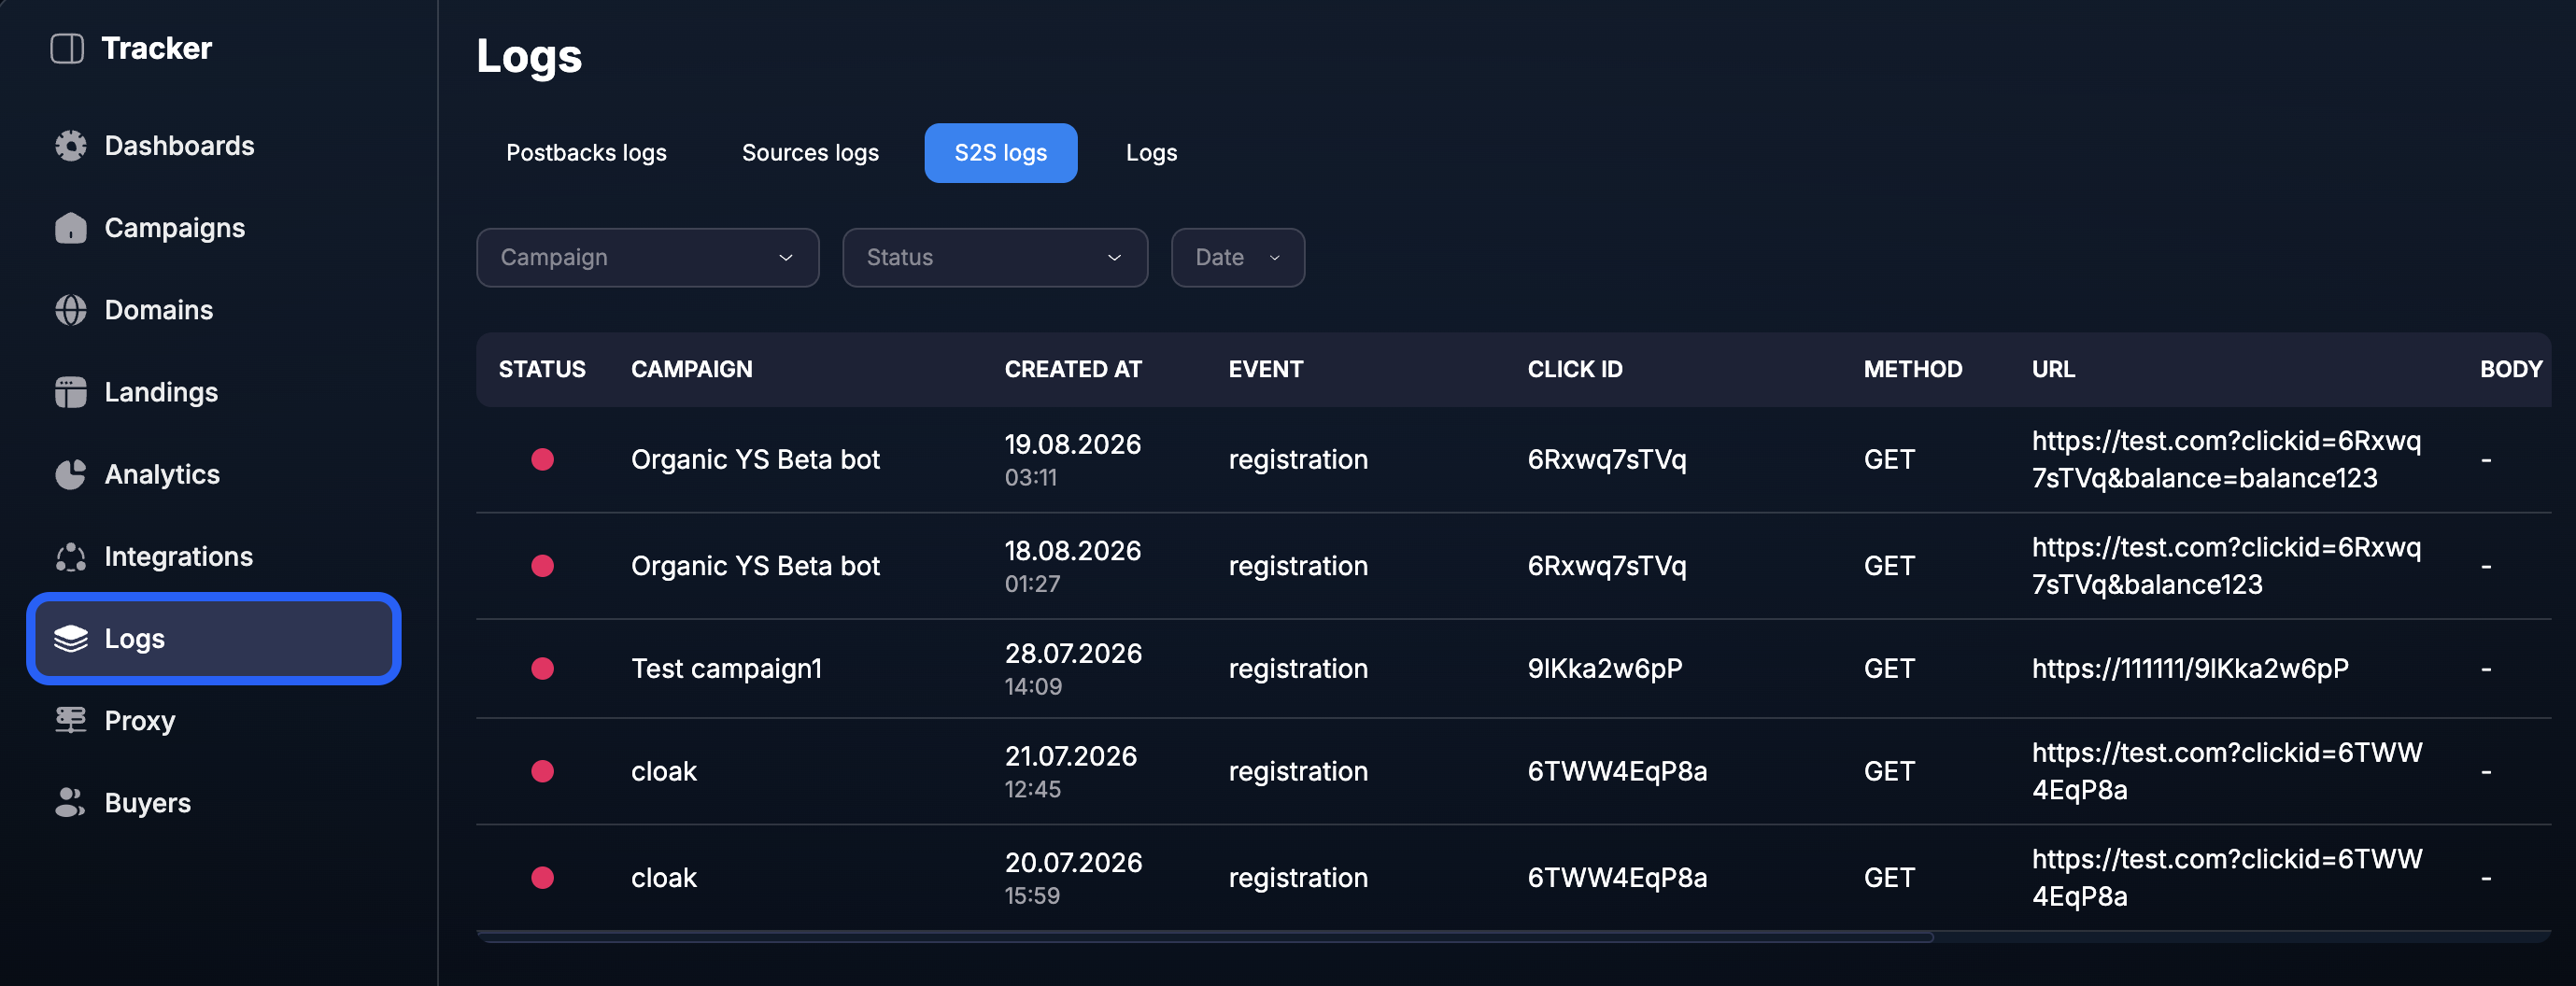
The S2S logs tab shows server-to-server requests for campaigns. Use it to check whether the call was created, which method it was sent with, and what data was transmitted to the destination address.
Filters
Records can be filtered by campaign, status, and date.
What the table shows
Status — request result; Campaign — campaign; Created At — time; Event — event; Click ID — click identifier; Method — HTTP method; URL — destination address; Body — request body, if used.
If a request is marked in red, check the Click ID, Method, URL, and Body sequentially.
Logs → Campaigns — campaign change history
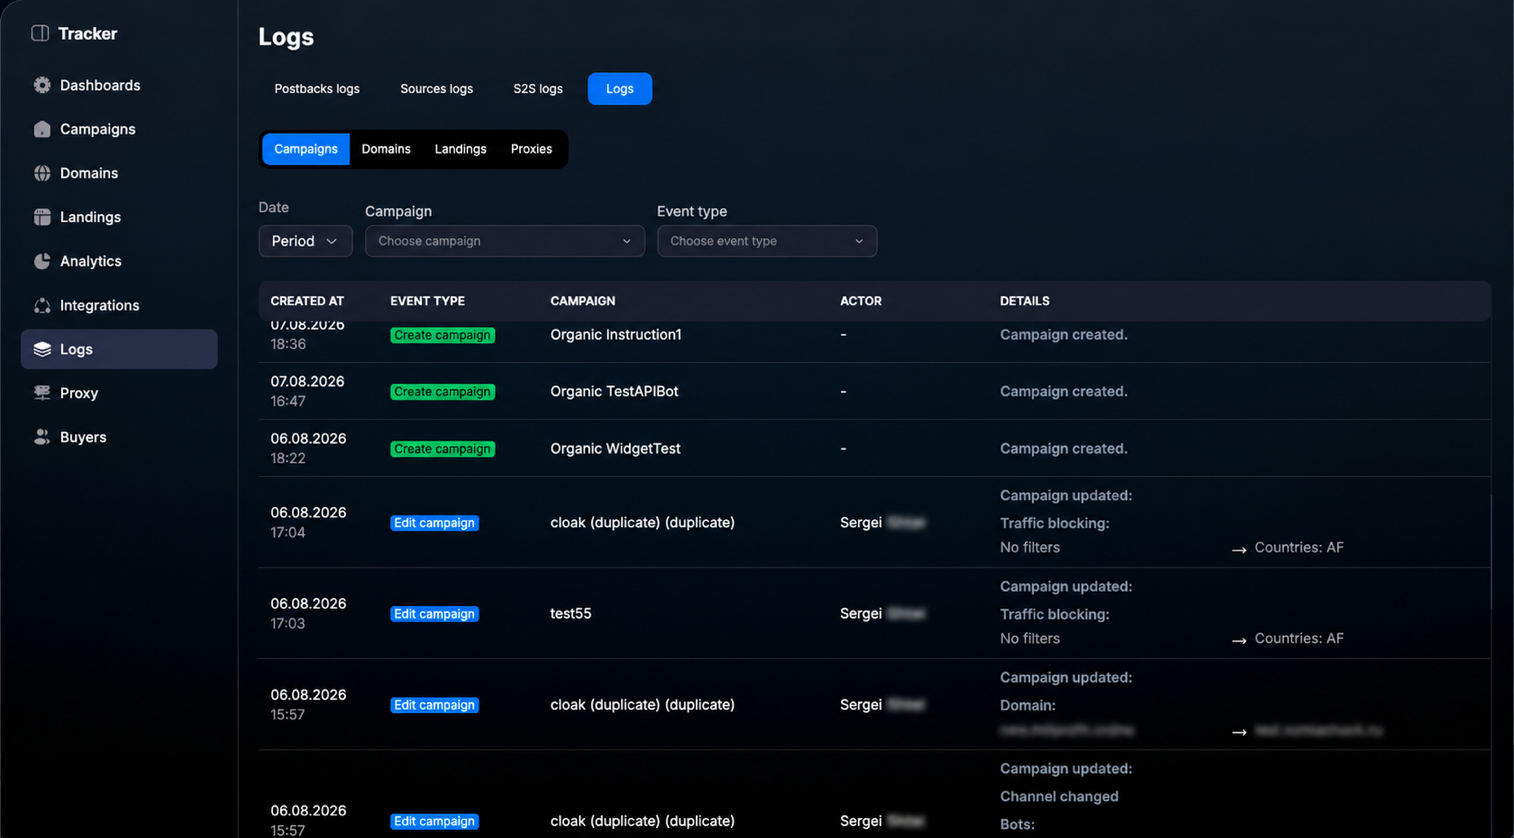
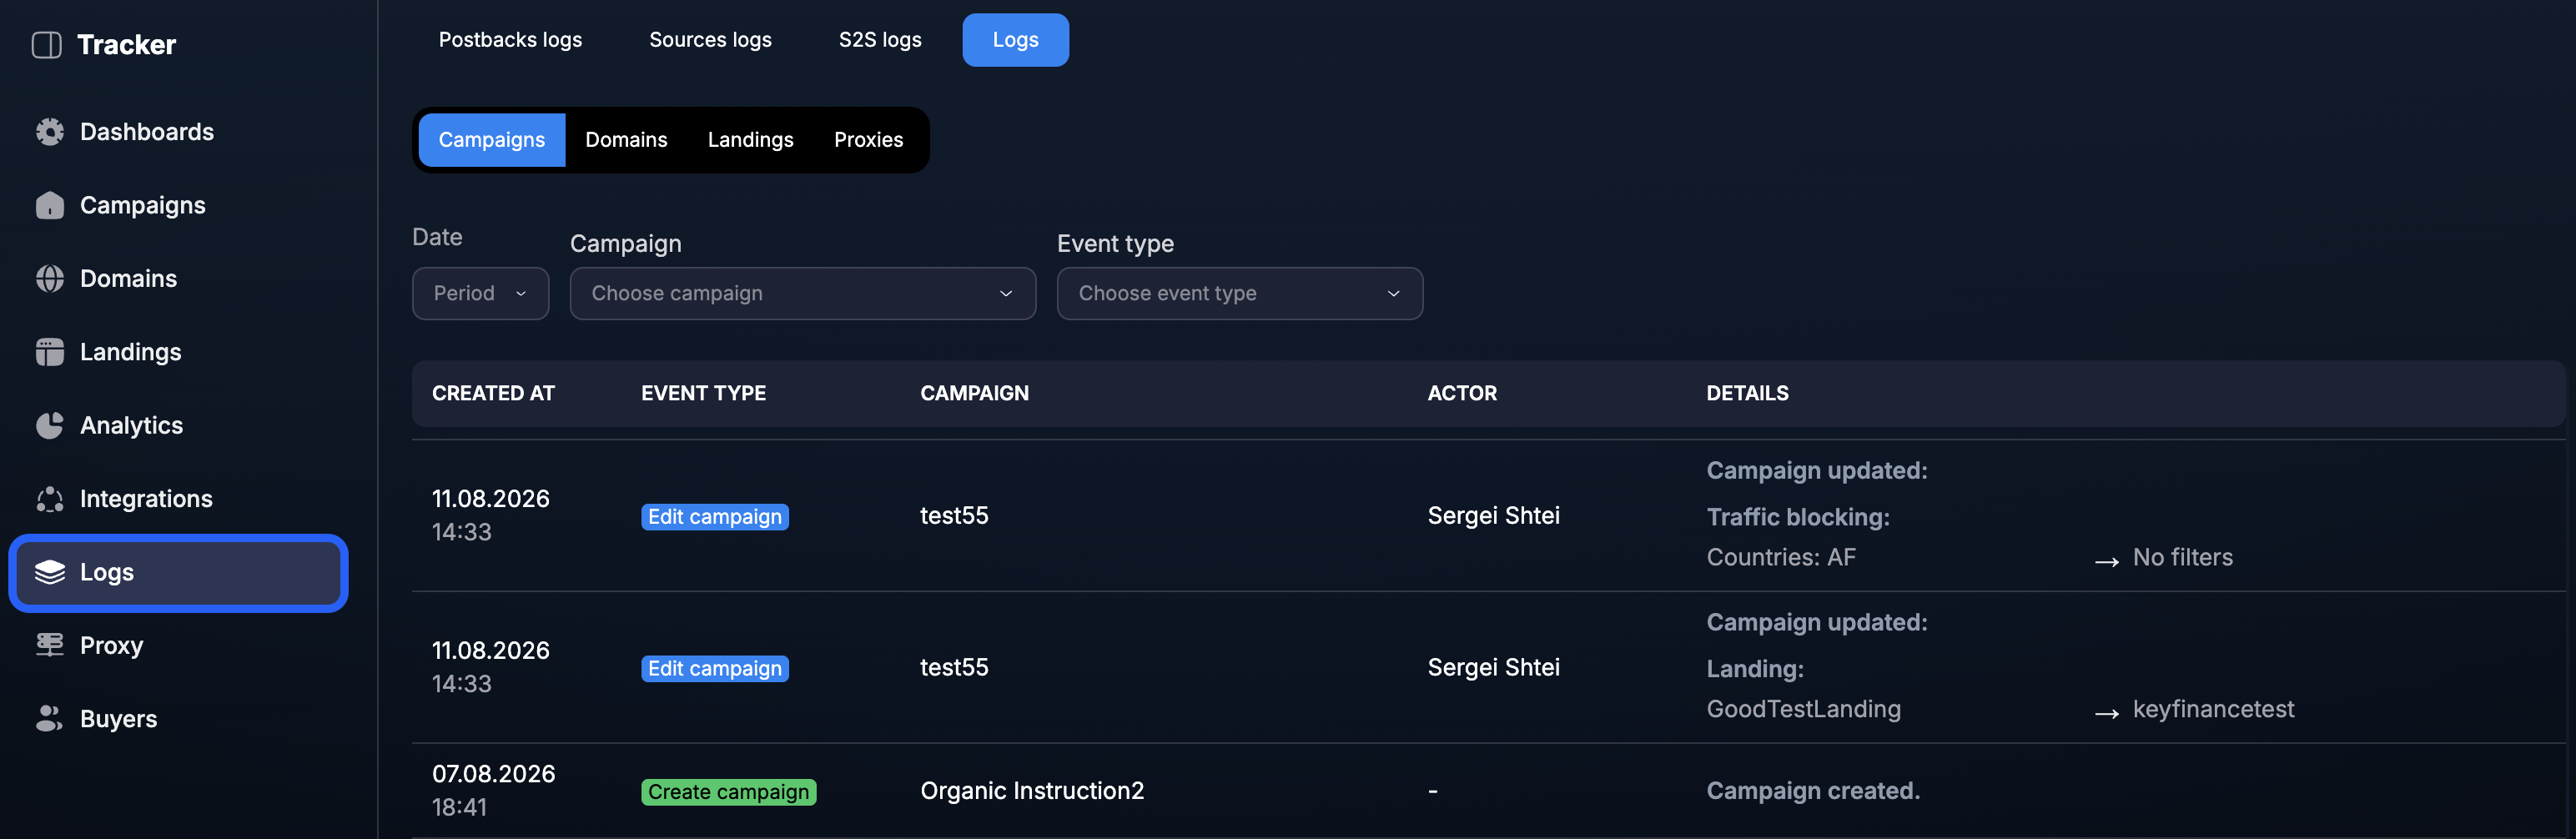
The Logs tab contains an audit of actions in Tracker. The Campaigns subsection displays campaign creation and editing, the user who performed the action, and specific setting changes.
Filters
Specify the period, campaign, and event type to find the change you need.
What the table shows
Created At — date and time; Event Type — creation or modification; Campaign — campaign name; Actor — user who performed the action; Details — modified parameters and values before and after the change.
Within Logs, subsections for Domains, Landings, and Proxies are also available — they operate on the same principle and show the action history for the corresponding objects.
How to quickly find the cause of an error
1. Select the log corresponding to the data transfer direction.
2. Limit the period and add filters for campaign, source, postback, or status.
3. Find the entry by Click ID and check the status.
4. For errors, examine the Error, URL, Body, or Details — the set of fields depends on the selected tab.
5. Match the same Click ID with other logs to reconstruct the full event chain.
Current S2S and audit screens
Below is the current interface for two Logs sections: S2S request verification and detailed audit of campaign changes.
Was this article helpful?