

How to Filter Dashboards
How to filter Dashboards This guide shows how, on the screen, to narrow metrics and charts down to a single campaign, source, buyer, or any parameter from the tracking link, and how to enable Group By
How to filter Dashboards
This guide shows how, on the Dashboards — Summary Analytics screen, to narrow metrics and charts down to a single campaign, source, buyer, or any parameter from the tracking link, and how to enable Group By to compare values within a slice. After the first run-through, a typical setup takes about 10–30 seconds.
What to prepare
In Campaigns — advertising campaigns, the fields that should be included in the link and then in the filters are configured (buyer, ad_name, sub1, UTM, and others). If a parameter is not passed in the URL, you cannot filter by it.

Steps
Open Filters
On theTracker→ Dashboards page, click the Filters button at the top of the screen.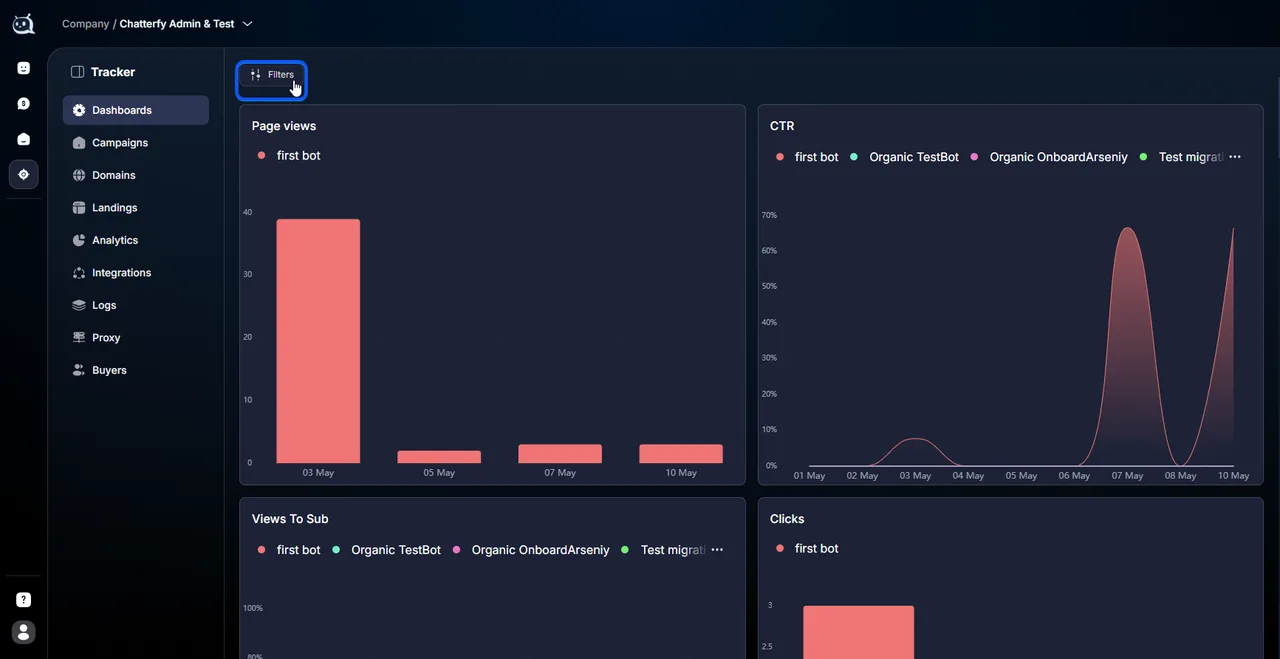
Select filtering parameters
Select the fields you need to create a slice by. The set of fields is formed from the parameters that actually come in clicks on your links. The names may differ from the examples below — use the list in the interface as your reference.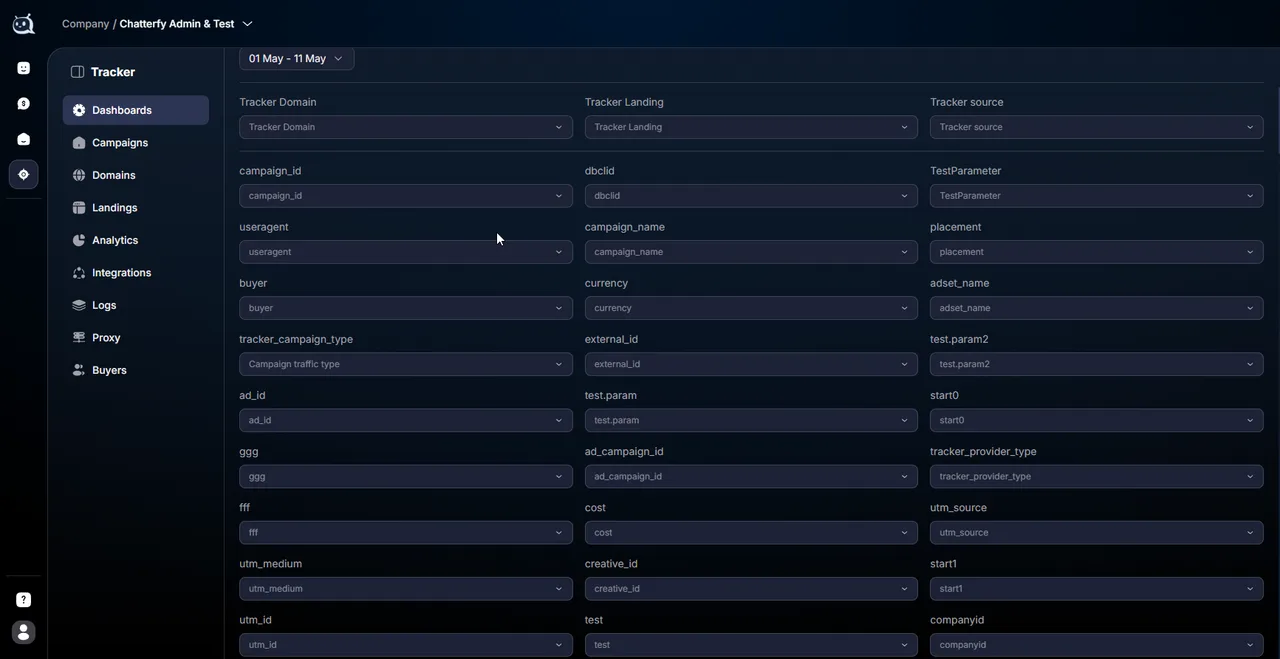
Enter values
For each selected field, enter the value exactly as it is passed in the link (case and spaces must match what is sent to tracking).Examples of value formats: buyer=ivan, ad_name=creative_v3 — for illustration only. Take your tokens from the ad account or from the markup in Parameters.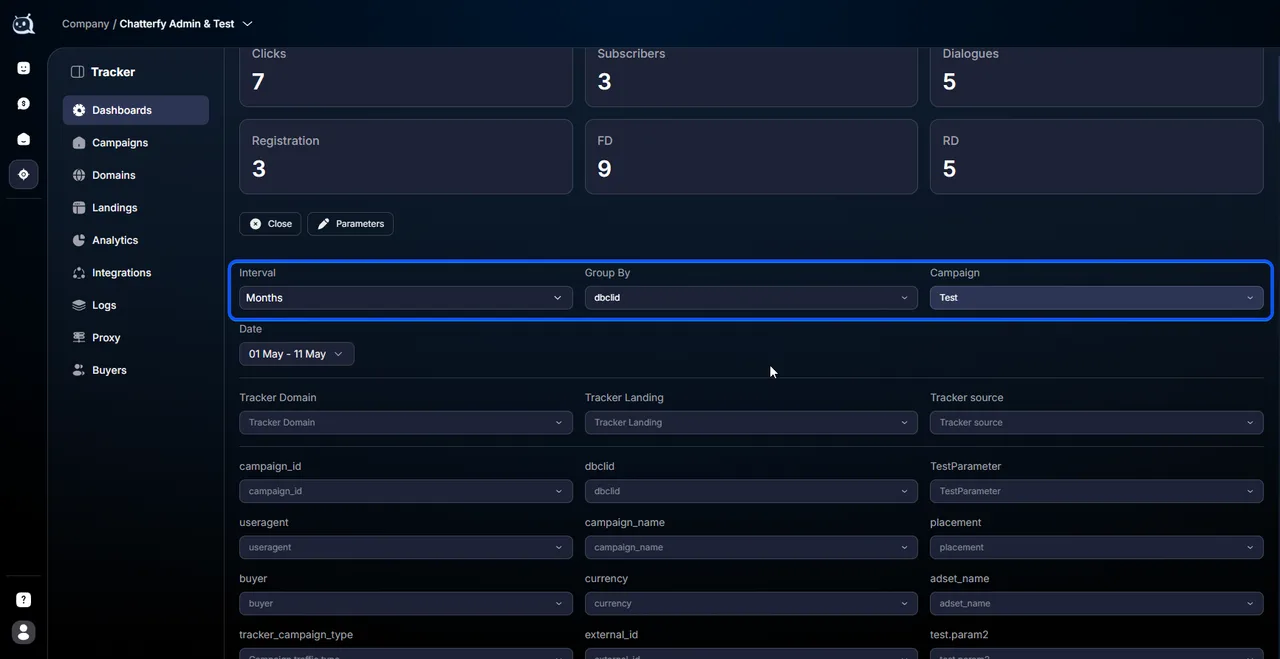
Click Search
The KPI tiles and charts are recalculated according to the selected conditions. One shared set of filters is applied to all blocks on the screen at the same time.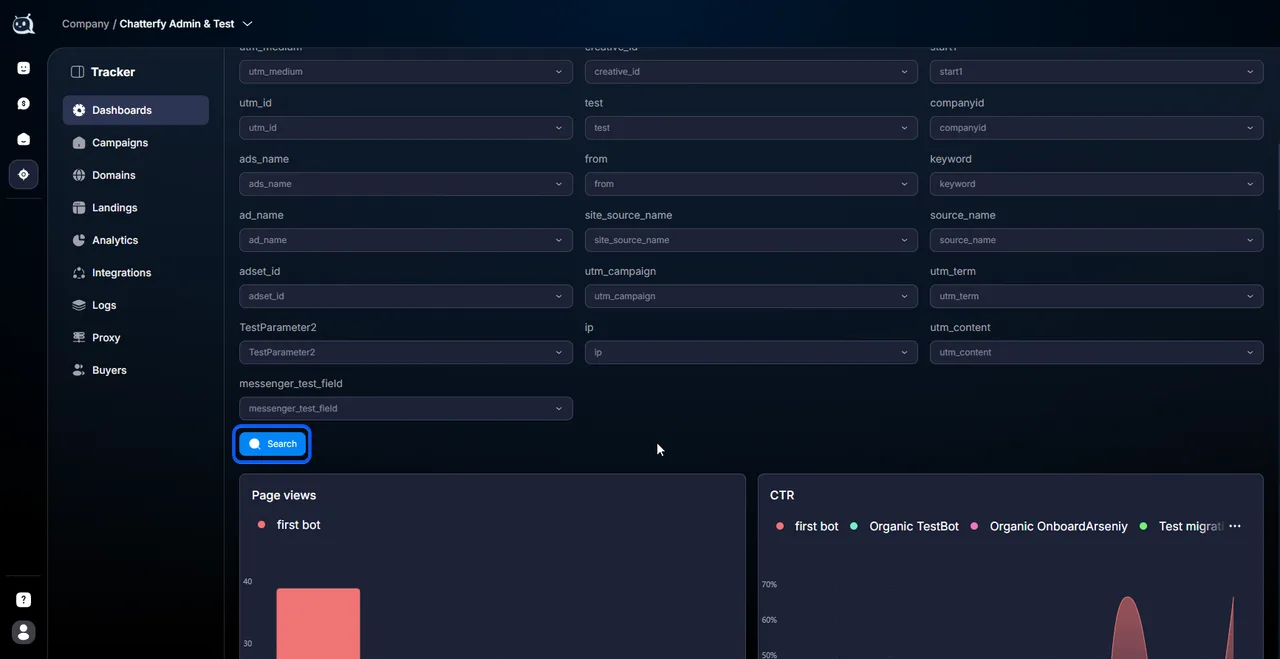


What parameters are available
Filtering is possible only by the keys that are added to the campaign link defined in Campaigns — advertising campaigns. Typical examples of names (the actual list is in the UI):
- identifiers or names of entities from the ad account (campaign_name, ad_campaign_id, adset_id, ad_name, and similar fields from your markup).
- placement or other platform fields.
- utm_source, utm_campaign, utm_content.
- keyword for search campaigns.
buyer and suffixes (sub1, sub2 …), if you pass them.
clickid — a detailed breakdown of a single click during debugging.
Any custom fields from Parameters also appear in the list if they are included in the URL.
Group By — data breakdown
Filters selects a subset of events (“only this campaign”). Group By sets the dimension by which metrics are split into multiple series (daily trends, creative comparisons, etc.).
Common Group By values:
- Day — by month or by day (as in the interface for your product version).
- source_name — comparison of sources within the filtered traffic stream.
- ad_name or another creative parameter from the link.
- buyer — comparison of buyers. For users with the Buyer role, row visibility is limited to their campaigns; the full team breakdown is available to the Buyer Team Lead and Admin — see Buyers (TRACKER → Buyers).
- any UTM or custom parameter from the list.
Only one Group By field can be set at a time. Splitting by several dimensions at once is easier to do in Analytics — detailed table— Analytics — detailed table.
Using Filters and Group By together
Example scenario logic:
- Filter: limit the traffic stream to one marketing campaign (the field and value from your markup).
- Group By: ad_name.
- Result — distribution of metrics by ads within the selected campaign. Use it to disable underperforming creatives and reallocate the budget.
Expected result
After Search, the numbers on the tiles and the lines on the charts correspond only to the selected clicks and events. When Group By is enabled, legends and series reflect the contribution of each value of the selected parameter.
If it doesn’t work
Use cases by segment
Arbitrage — filter by campaign, Group By: creative. Disable the ad with an outlier CTR.
Performance — filter by the campaign's internal name, Group By: source_name. Compare Facebook and
Telegramby ROI within a single offer.Buyer Team Lead — no filter or a filter by team, Group By: buyer. Weekly summary for group members for the call.
What's next


Was this article helpful?