

Cohorts — cohort analysis
Tracker → Cohorts allows you to compare groups of leads and track how conversion or revenue changes over time after entering the funnel. Select entry and target events to see the journey from the firs
Tracker → Cohorts allows you to compare groups of leads and track how conversion or revenue changes over time after entering the funnel. Select entry and target events to see the journey from the first event to registration, first deposit, channel subscription, or another action.
Lead — click or visit
In Tracker, a lead is not equivalent to a unique person. Keep this in mind when comparing lead counts, conversion, and revenue per lead.
What is a cohort and lead age
A cohort groups leads by their entry period. For example, with a daily size, one table row contains leads whose entry event occurred on the same day.
Lead age is the time elapsed since the selected Entry event. This allows you to compare cohorts that entered the funnel on different calendar dates at the same stage: on the entry day, after one day, after two days, and so on.
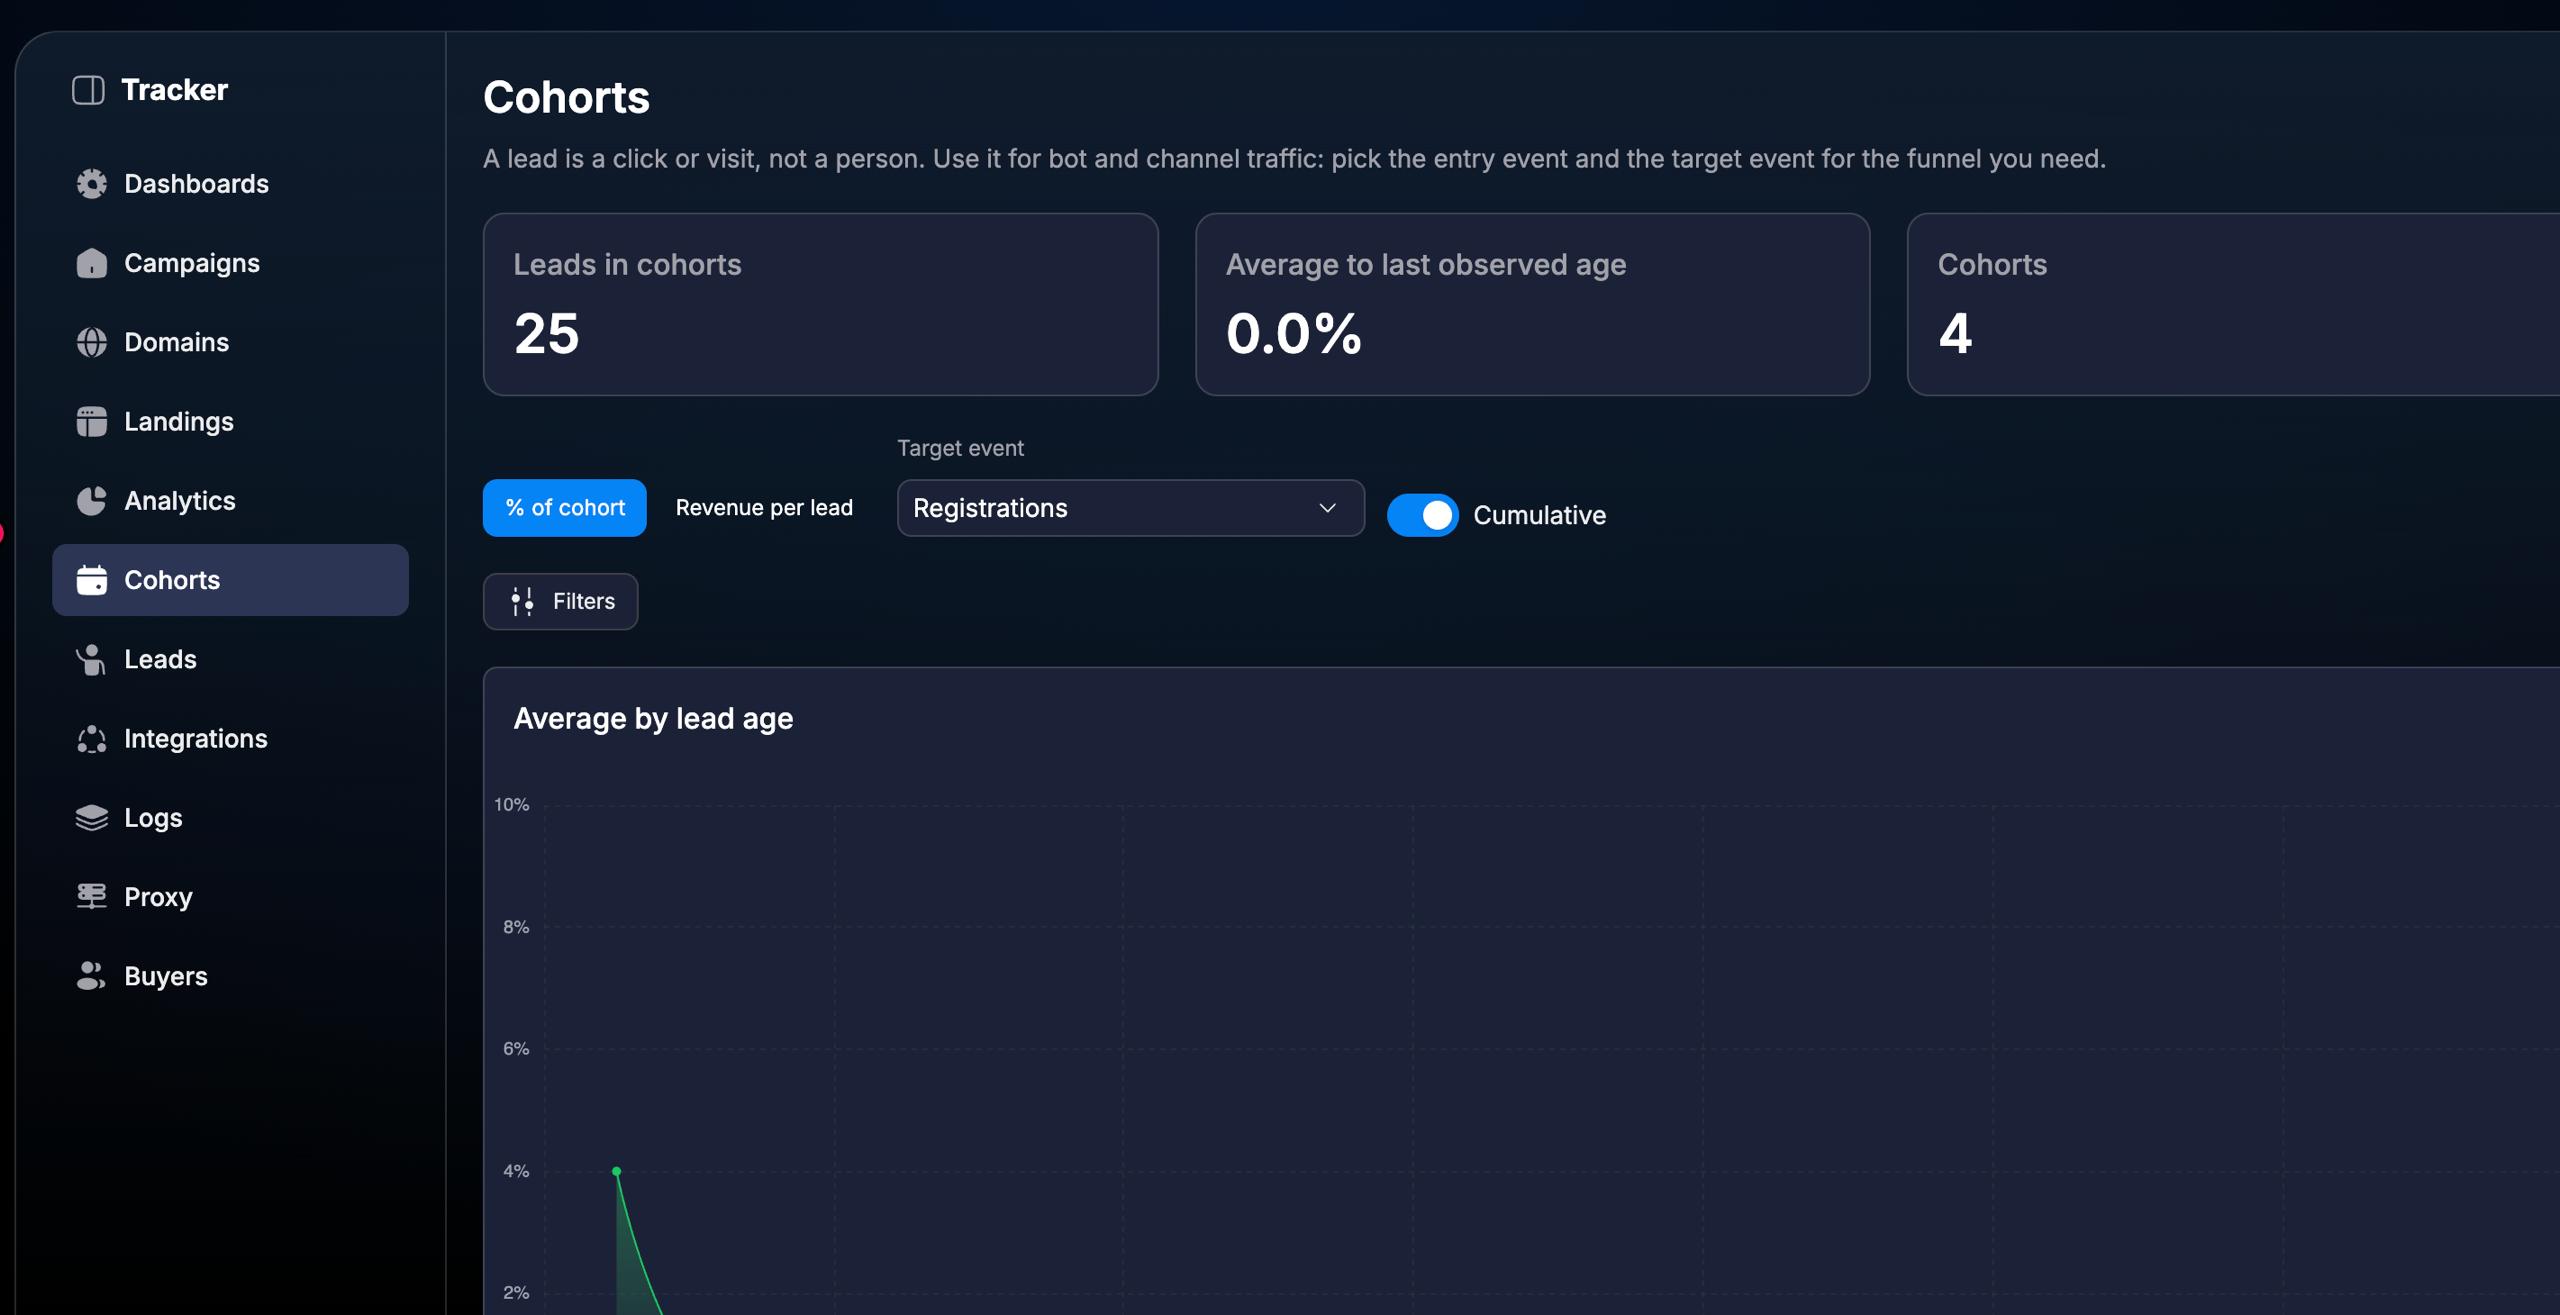
Quick report setup
1. Open Cohorts
Go to Tracker → Cohorts.
2. Choose a result
Set the Target event and the mode to % of cohort or Revenue per lead. Enable Cumulative if you need a cumulative indicator.
3. Set the entry window
Open Filters and select a period in Entry window.
4. Configure cohorts
Set the Entry event, Cohort size, Age step, and Age depth.
5. Refine the selection
If necessary, use Group By, campaign and source filters, or additional parameters.
6. Compare results
View the Average by lead age chart and the cohort rows in the table.
Target events and metrics
Target event — the target action whose achievement you want to analyze: Registration, FD, Subscribe channel, and other available events.
% of cohort — conversion to the selected target event as a percentage of the total number of leads in the cohort.
Revenue per lead — revenue calculated per individual lead. This mode helps you compare cohort results based on revenue.
Cumulative — cumulative display of the selected metric from the start of the reference period to the corresponding lead age.
Use the same event and metric settings to compare cohorts. Conversion percentage and revenue per lead answer different questions and have different units of measurement.
Cohort period and parameters
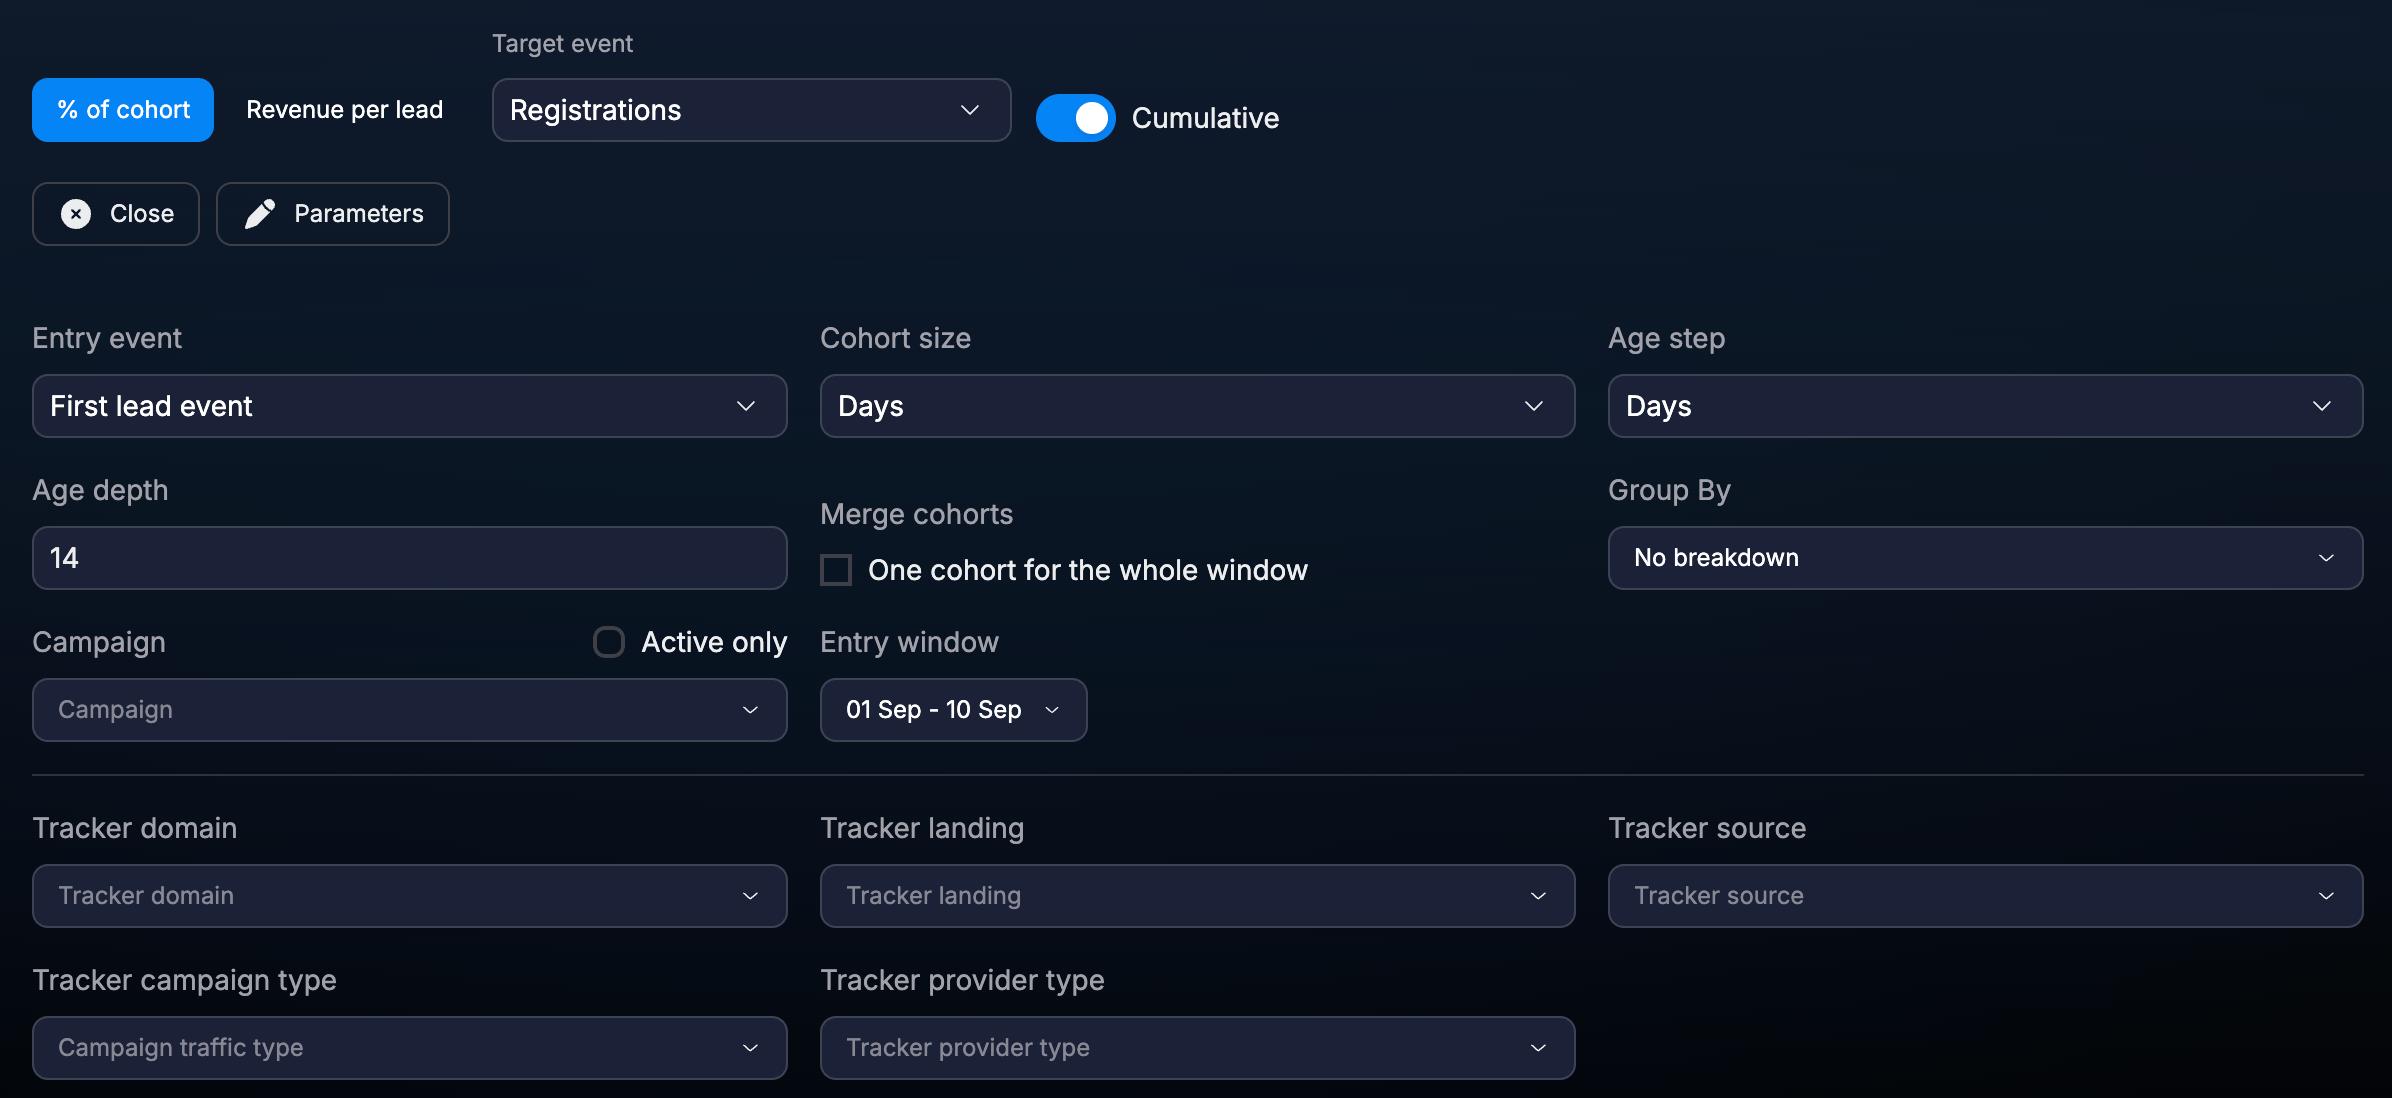
Entry event — the event that starts the reference period for a lead. For example, First lead event.
Entry window — the period during which lead entries are included in the analysis.
Cohort size — the time interval for grouping leads into cohorts, for example, Days.
Age step — the observation interval after entry, for example, one day.
Age depth — depth of analysis: the number of time intervals within which subsequent events are considered. With the Days step, a value of 14 sets the analysis by days to a depth of 14 days.
Merge cohorts — the One cohort for the whole window setting merges leads for the entire selected entry window into a single cohort.
Group By — grouping data by available parameters. No breakdown means there is no additional segmentation.
Traffic filters
In Filters, you can restrict the selection by campaign (Campaign), domain (Tracker domain), landing page (Tracker landing), source (Tracker source), campaign traffic type (Tracker campaign type), and provider type (Tracker provider type).
The Active only checkbox allows you to display only active campaigns. Additional parameters and their values passed to the Tracker are available via Parameters.
If you need to compare sources or campaigns, first set the same entry window, event, and analysis depth, then apply the necessary filters or grouping.
How to read the chart and table
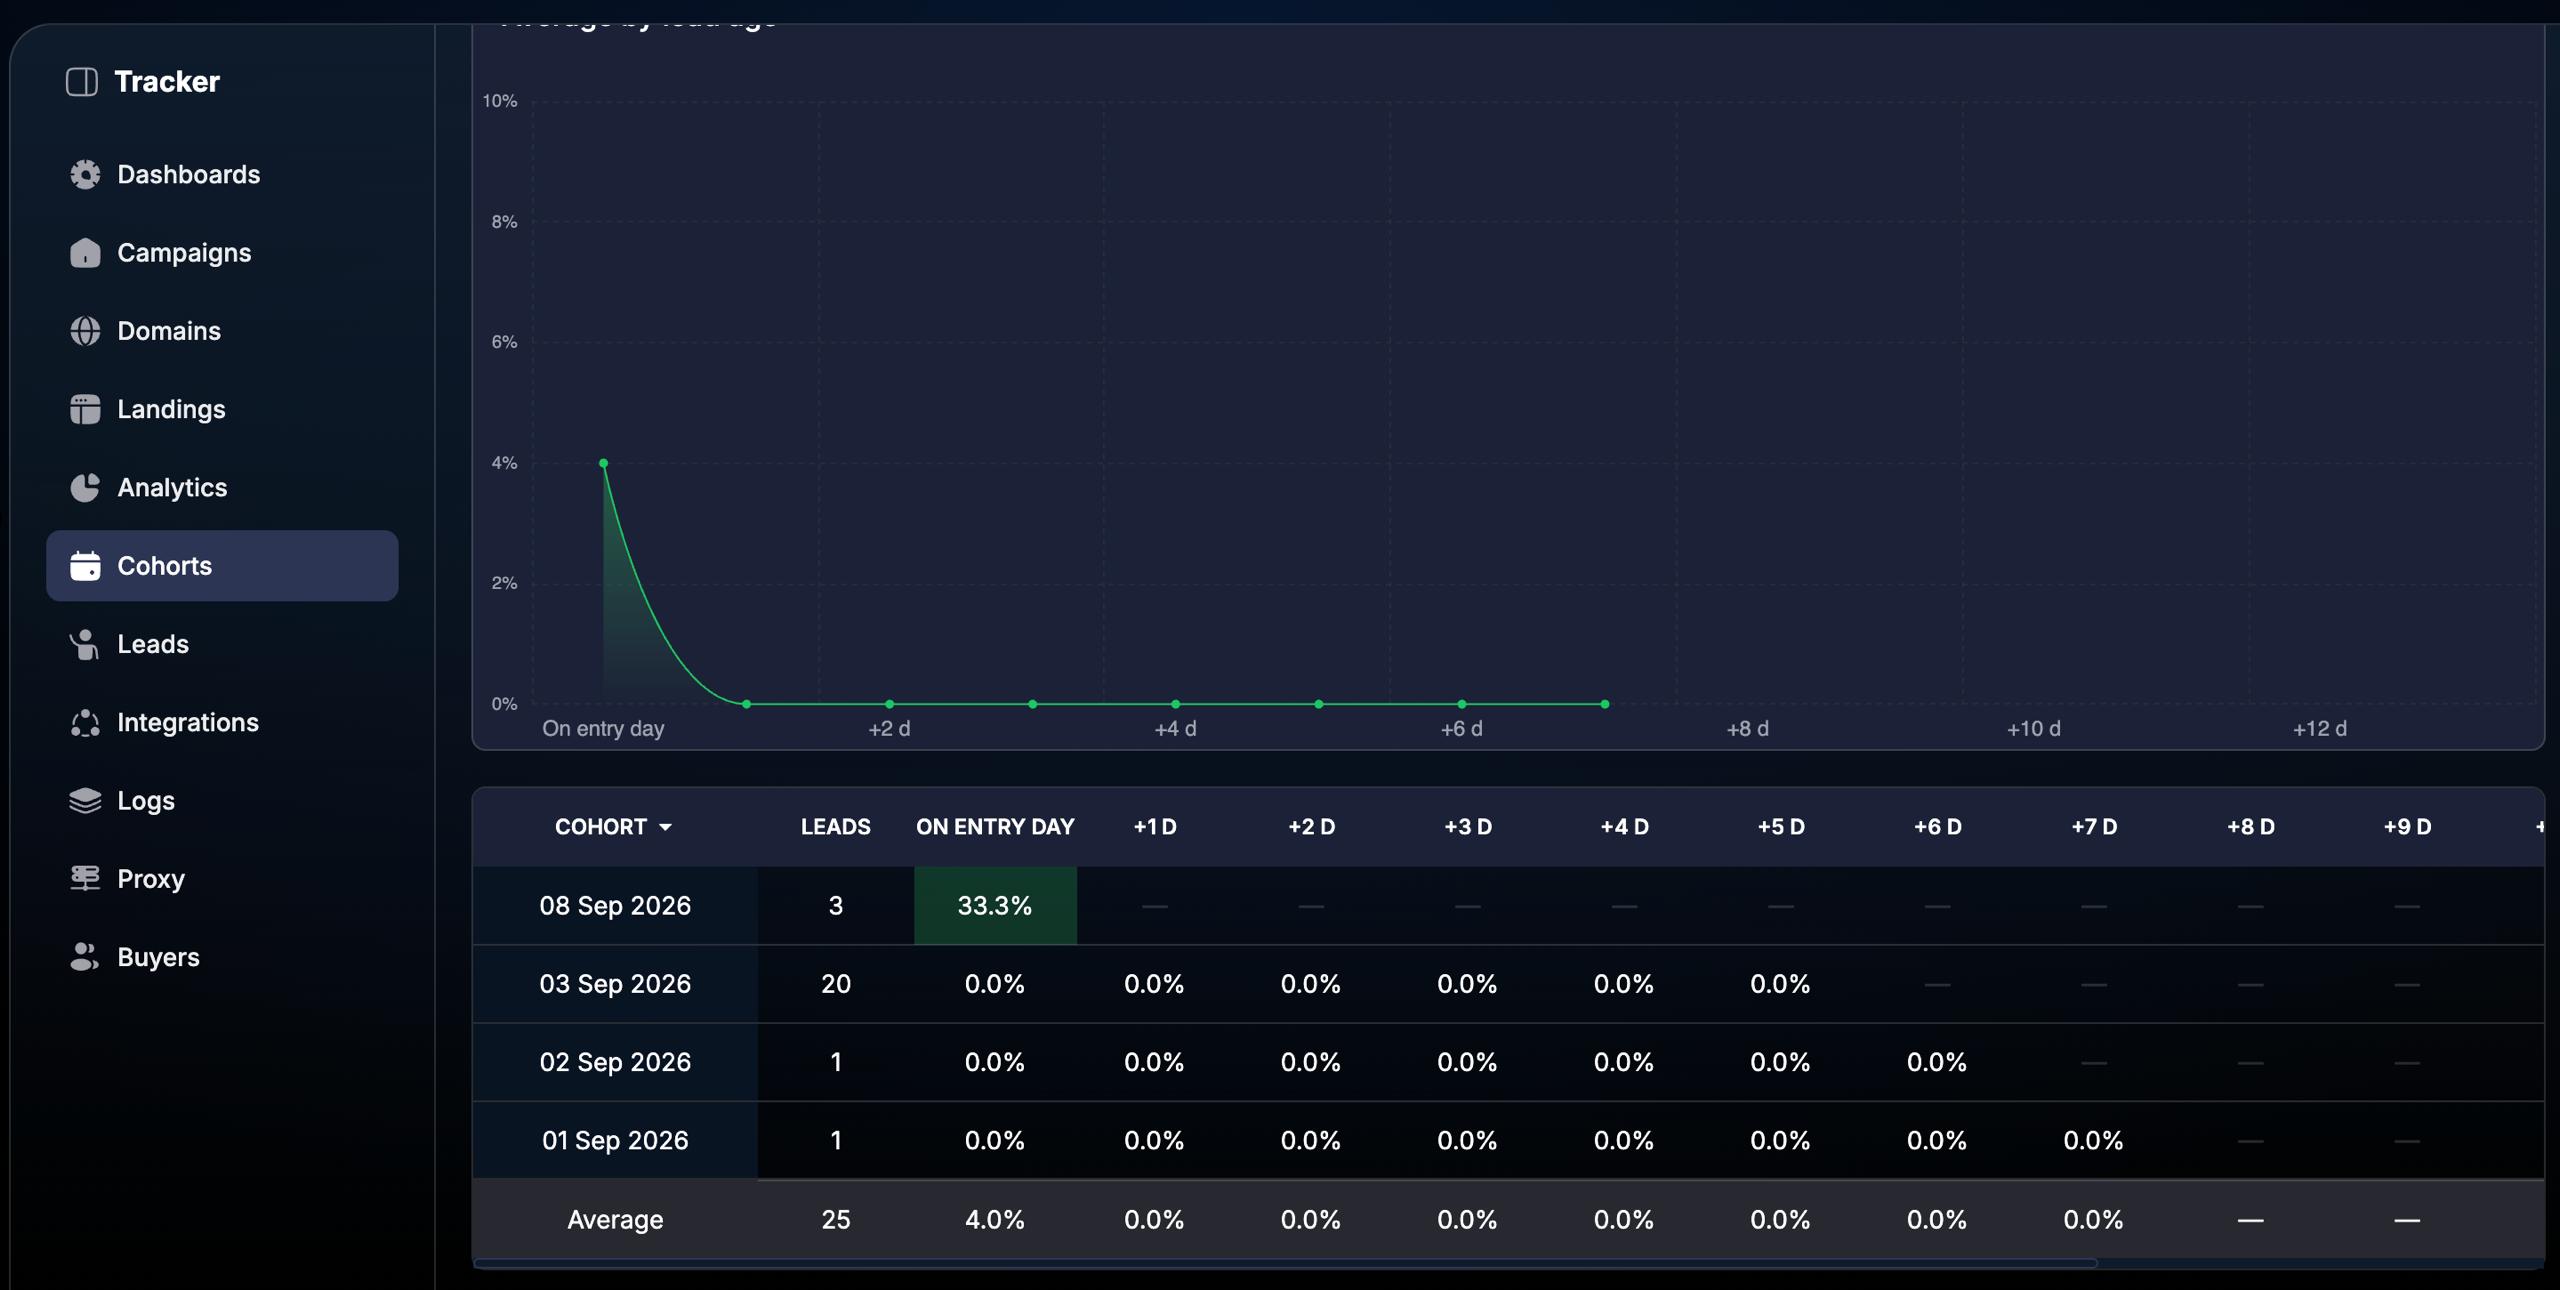
The Average by lead age chart shows the change in the selected metric by lead age. It helps identify at which stages after entry conversion or revenue changes.
Cohort — the cohort for which results are displayed.
Leads — the number of leads in the cohort.
On entry day — the metric value on the day of entry.
+1D, +2D, and so on — values after one, two, and subsequent days with a daily step.
In % of cohort mode, the cells show the conversion percentage. The Average row provides a summary result. Compare values at the same lead age: a new cohort does not yet have the same observation history as an older one.
Example: path to registration
Select Registration as the Target event, First lead event as the Entry event, Days for Cohort size and Age step, and set Age depth to 14. In Entry window, specify the lead acquisition period. Enable Cumulative for cumulative conversion.
Compare the values for On entry day, +1D, and subsequent days between cohorts. This allows you to assess whether the majority of registrations occur immediately after entry or several days later. To check individual records, use the Leads section.
FAQ
How does Cohort size differ from Age step?
Cohort size determines the interval over which leads are grouped. Age step determines the observation interval for events after entry. These are two independent settings.
How does Entry window differ from Age depth?
Entry window selects the time frame for leads entering the analysis. Age depth specifies how far after entry their subsequent events are tracked.
What should I do if the expected events are not in the report?
Check the Target event, Entry event, entry window, and applied filters. Then, find the specific lead in Leads and see which events and dates are registered for them.
Related article
Was this article helpful?